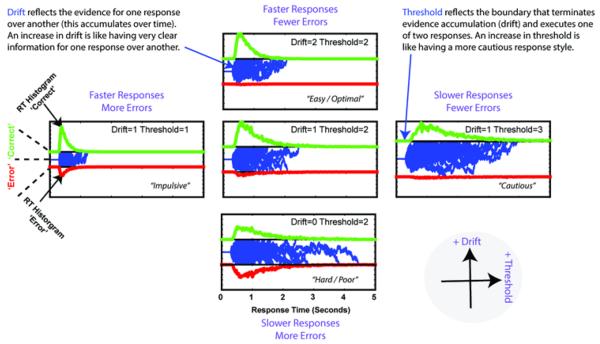
Figure 2.
Example of latent Drift Diffusion Model (DDM) parameters. Noisy sensory evidence (blue traces) accumulates towards a bound, whereupon a response is initiated. The duration and direction of these evidence accumulation processes account for the RT distributions in each of the (binary) conditions (here, correct and erroneous choices are shown). On the vertical axis, an increase in drift rate accounts for increased evidence for one response over another, leading to shorter RTs and better accuracy (bottom towards top). On the horizontal axis, and increase in decision threshold raises the boundaries for response execution, leading to longer RTs and better accuracy (left toward right).

