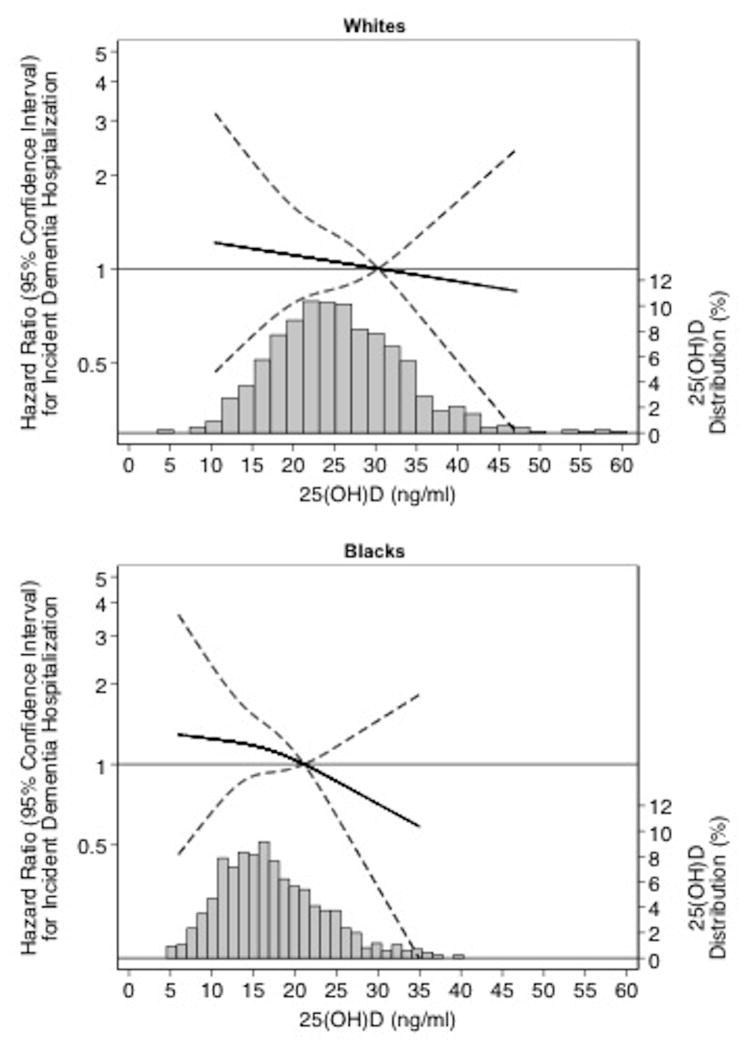
Figure 1.
Legend. Adjusted* restricted cubic spline model showing the hazard ratios (95% confidence intervals) for the association of 25(OH)D with incident dementia in whites and blacks. The solid line represents the hazard ratios and the dashed lines represents the 95% confidence intervals. Knots at 10th, 50th, and 90th percentiles. Spline centered at the 75th percentile. Histogram shows the distribution of concentrations of 25(OH)D. Restricted cubic spline truncated at 1st and 99th percentile of 25(OH)D.
*Model is adjusted for demographics variables (age, sex) and behavioral/socioeconomic variables (education, income, physical activity, smoking, alcohol use, body mass index, waist circumference, and vitamin D supplementation).

