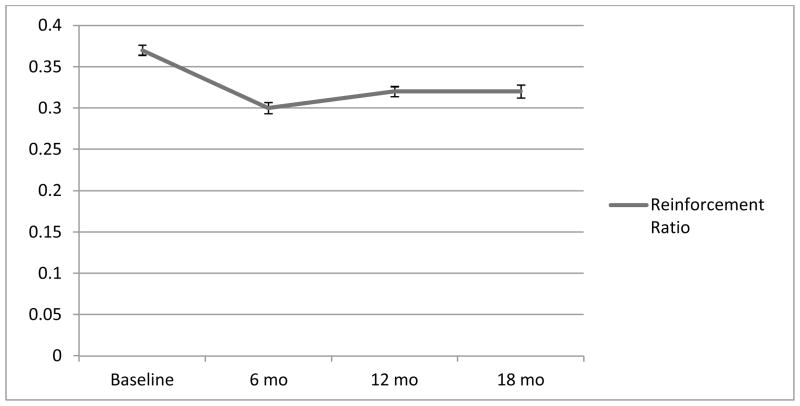
Figure 1.
Change in Reinforcement Ratio from Baseline to 18 months
Note. The Y-axis contains the average reinforcement ratio (RR) values. The RRs were computed with the following formula: average food-related cross product / average food-related plus average food-free cross product. RR values can range from 0 (no reinforcement related to food) to 1 (100% of reinforcement related to food) Error bars reflect one standard error of the mean.

