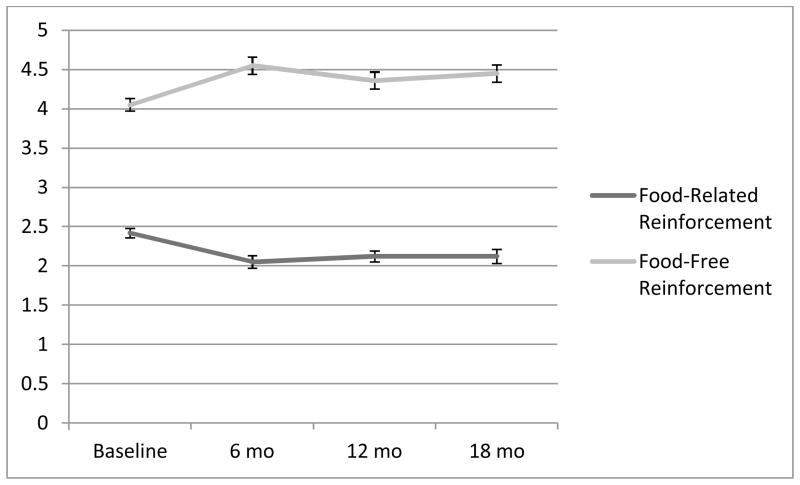
Figure 2.
Change in Food and Food-Free Reinforcement from Baseline to 18 months
Note. The Y-axis contains the average food-related and food-free reinforcement values. Both frequency and enjoyment are rated on a 4 point scale [range=0 (zero times per week) to 4 (more than once per day)] and enjoyment ratings [range=0 (unpleasant or neutral) to 4 (extremely pleasant), respectively]. A cross-product, reflecting “obtained reinforcement” from each activity, was computed by multiplying the frequency and the enjoyment ratings (separately for food-related and food-free participation). The average of the food-related and food-free cross-product scores were computed to measure average food-related and food-free reinforcement for each individual. Error bars reflect one standard error of the mean.

