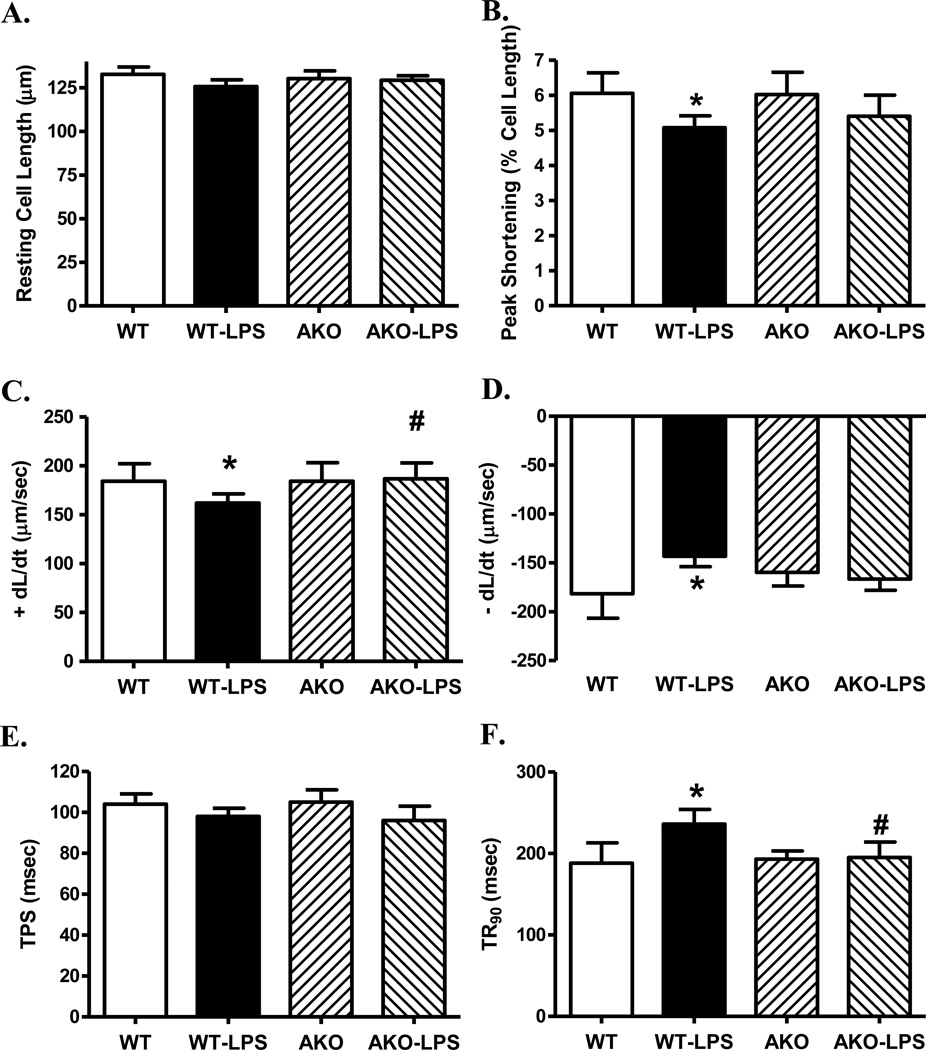
Fig. 1.
Cardiomyocyte contractile properties in WT and Akt2 knockout (AKO) mice treated with LPS (4 mg/kg, i.p.) or saline for 4 hrs. A: Resting cell length; B: Peak shortening (normalized to cell length); C: Maximal velocity of shortening (+ dL/dt); D: Maximal velocity of relengthening (−dL/dt); E: Time-to-peak shortening (TPS); and F: Time-to-90% relengthening (TR90). Mean ± SEM, n = 4 mice (35–37 cells per mouse) per group; * p < 0.05 vs. WT group, # p < 0.05 vs. WT-LPS group.

