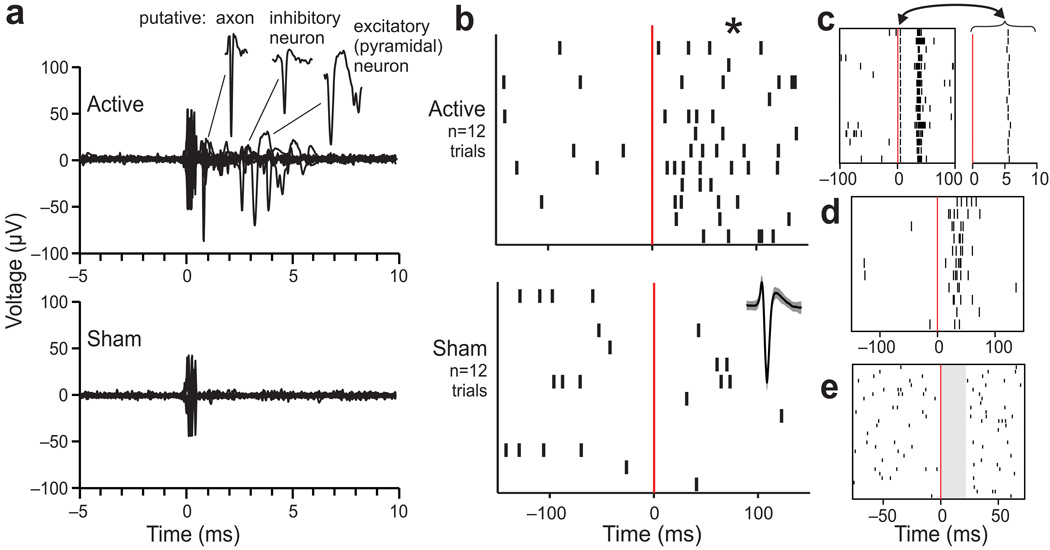
Figure 4.
Recordings of neuronal spikes activated by single pulse TMS. (a) Example raw data from 20 sequential applications of 70% active TMS (top) and sham TMS (bottom) at the same site in one animal. These data were selected for illustration because the TMS elicited activation of diverse neuronal elements. As shown in the extracted segments (upper right), example action potentials included those from a putative axon (very narrow), inhibitory interneuron (broader), and excitatory neuron (very broad)31. (b) For quantification, rasters of action potential times relative to active (top) and sham (bottom) TMS pulses at time zero (red lines) are plotted for an example neuron (its waveform average and ±s.e.m. is shown at right in the sham graph). The neuron was activated significantly by active TMS (*, p < .01; see text). (c–e) Examples of TMS-induced activity in three other neurons. The neuron of panel c showed short-latency activation (magnified at right for clarity) followed by apparent inhibition and then a burst. The neuron of panel d showed no short-latency activation, but had a surge of activity around 20–40 ms latency. The neuron of panel e showed clear suppression in activity (shaded) for about 20 ms after TMS. In general, we found that single pulse TMS caused patterns of responses that were reliable for each neuron but diverse between neurons.

