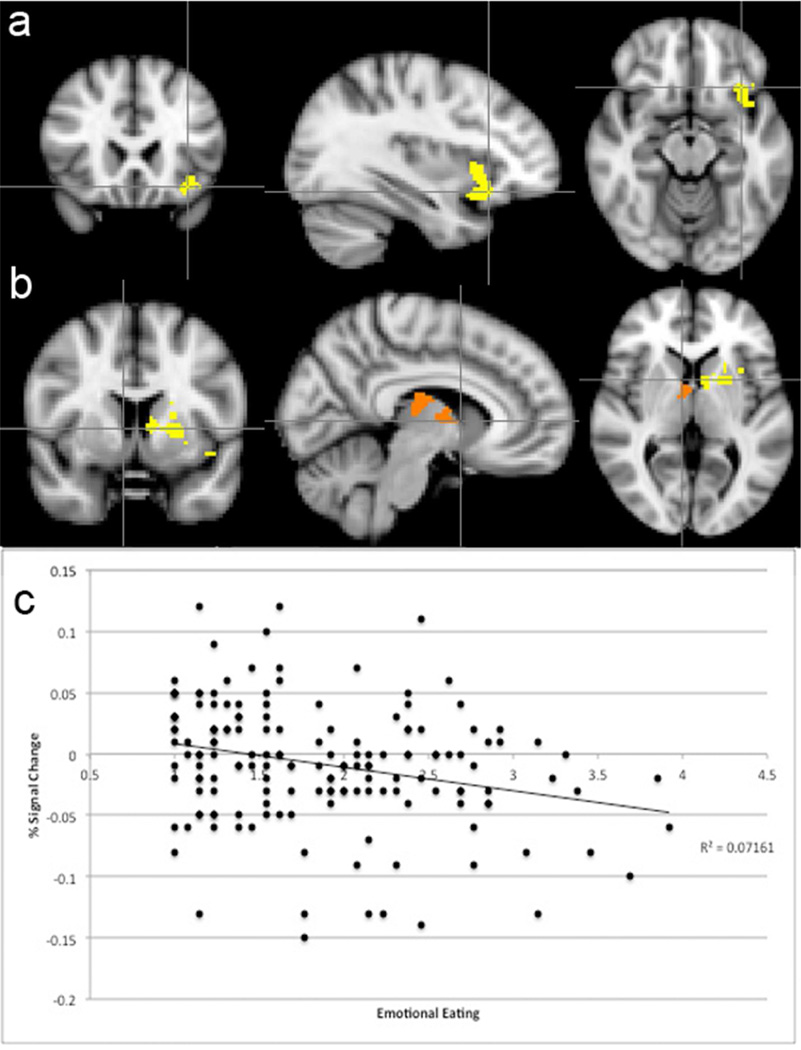
Figure 1.
Negative correlation between emotional eating and signal change in (Panel A) the left insula and orbitofrontal cortex and (Panel B) right thalamus, putamen, and caudate and the left caudate and putamen. Images are in radiological view on the MNI-152 standard brain, with the left hemisphere displayed on the right in axial and coronal slices. Panel C: Scatterplot reveals percentage signal change averaged across the significant clusters as function of emotional eating. The overall pattern shown in the scatterplot was present for individual peaks, as well.

