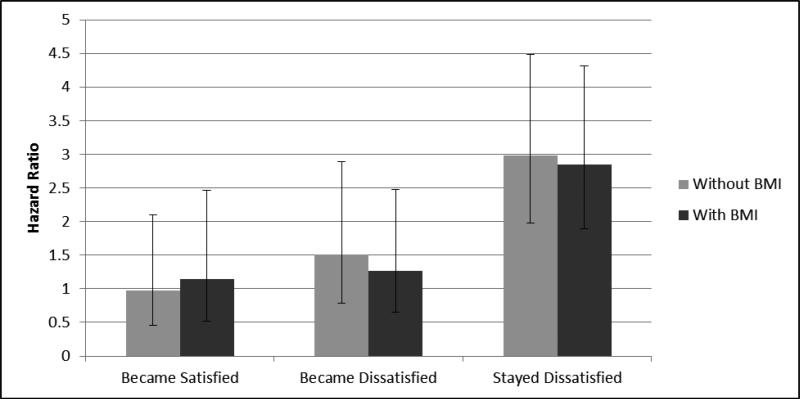
Figure 1.
Hazard ratios for diabetes incidence and 95% confidence intervals for the change in weight satisfaction. ‘Became Satisfied’, ‘Became Dissatisfied’, and ‘Stayed Dissatisfied’ were compared to the ‘Stayed Satisfied’ category. All models adjusted for baseline age, sex, and family history of diabetes, and the change in smoking status, physical inactivity, and alcohol intake. Light grey bars represent adjusted models without BMI and the dark grey bars represent adjusted models with additional adjustment for BMI.

