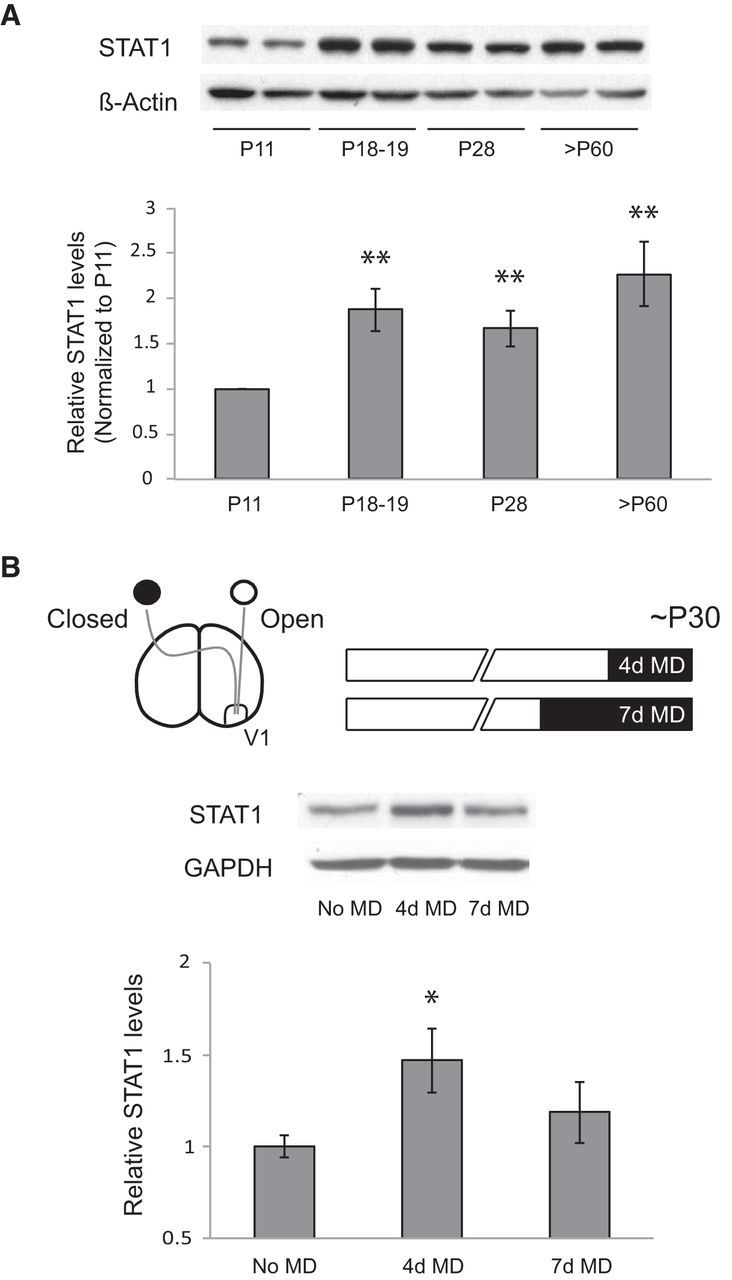
Figure 1.

Developmental and deprivation-induced changes in STAT1 expression in visual cortex. A, STAT1 protein levels at various postnatal ages (n = 8 animals for each age; **p < 0.01 vs P11). β-Actin was used as a loading control, and the values were normalized to P11. B, Schematic drawing of an experimental paradigm for 4 and 7 d MD during the critical period (top). STAT1 protein levels after 4 or 7 d MD (n = 7–9 animals for each condition; *p < 0.05 vs no MD). GAPDH was used as a loading control, and the values were normalized to no MD. Averaged data are presented as mean ± SEM.
