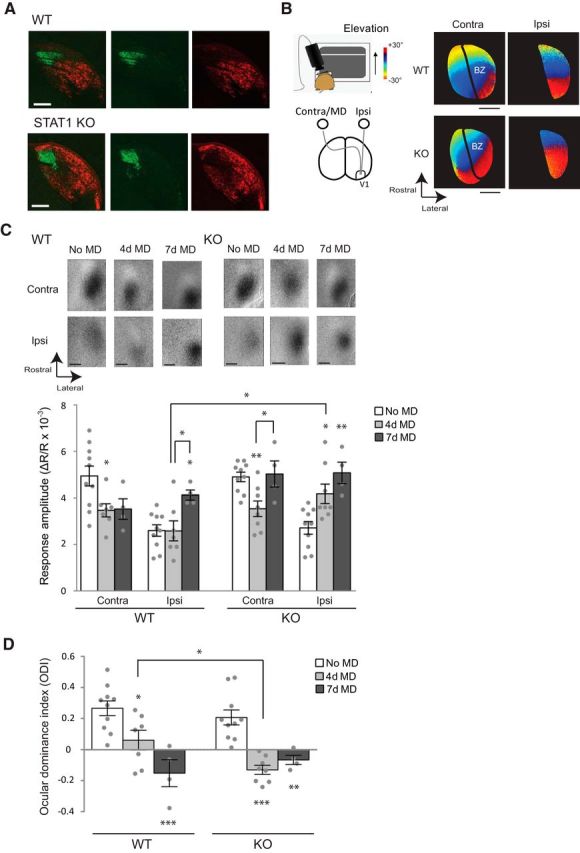
Figure 2.

STAT1 KO mice show enhanced OD plasticity though an accelerated increase in open-eye responses. A, Projections from the retina to the dLGN after CTB injections into each eye (red, contralateral; green, ipsilateral) in WT and STAT1 KO mice. Scale bars, 200 μm. B, Schematic drawing of optical imaging (left) and images of retinotopic maps (right) in V1 in response to stimulation of the contralateral (Contra) and ipsilateral (Ipsi) eyes. BZ, Binocular zone. Scale bars, 500 μm. C, Response amplitude maps in V1 (top) and their quantification (bottom) for the contralateral and ipsilateral eyes after 4 or 7 d MD of the contralateral eye during the critical period (WT no MD, 4 d MD, and 7 d MD, n = 10, 7, and 4 animals, respectively; STAT1 no MD, 4 d MD, and 7 d MD, n = 10, 8, and 4 animals, respectively). Scale bars, 500 μm. D, ODI values in WT and STAT1 KO mice. In C and D, individual data points are plotted as circles, and asterisks above bars show statistical significance compared with no MD in each group. Averaged data are presented as mean ± SEM. *p < 0.05, **p < 0.01, ***p < 0.001.
