
Figure 1.
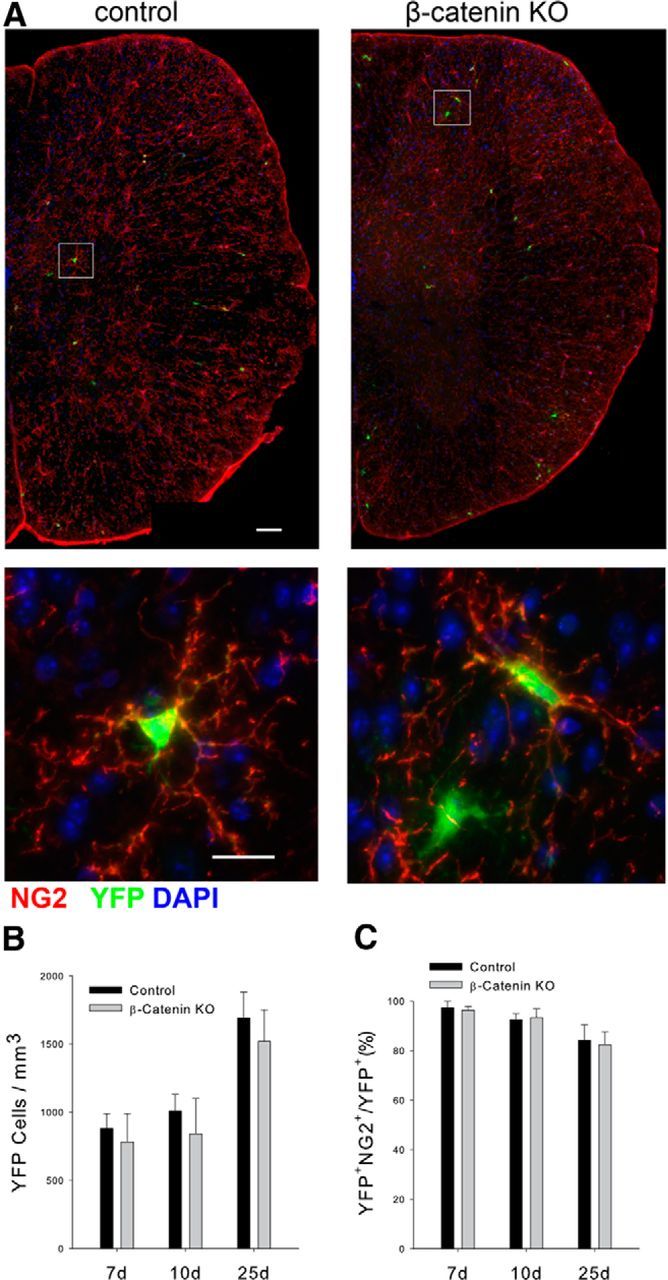
Characterization of the β-catenin KO and control animals. A, The appearance of YFP+ cells in control and β-catenin KO spinal cord 10 d after initiating tamoxifen treatment. Scale bar, 50 μm. Bottom shows individual YFP+, NG2+ OPCs from both genotypes. Scale bar, 10 μm. B, Quantitation of the density of YFP+ cells at the indicated times after initiating tamoxifen treatment. C, The percentage of YFP+ cells colabeled with NG2. There is no statistical difference in the density of OPCs between the two genotypes; n = 3 for all time points and groups.