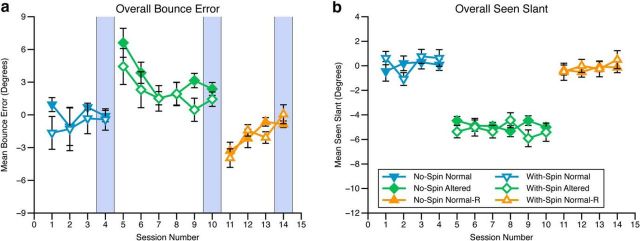
Figure 2.
a, Mean bounce error across sessions during the ball bounce task. b, Mean seen slant during each session of the ball bounce task (note: Normal-R = Normal bounce regained). Error bars show SEM. The blue vertical stripes highlight the final block of each phase of the experiment. These are included on the data plots to ease comparison across this figure and Figure 3.

