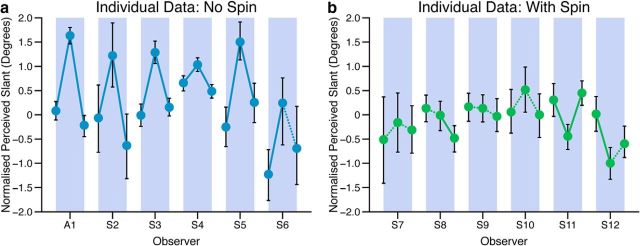
Figure 4.
Recalibration effect for each observer in the (a) nonspinning ball and (b) spinning ball groups. This is in the same format as Figure 3c, and shows the slant perceived as frontoparallel at the end of each phase of the experiment, i.e., sessions 5, 11, and 15, as highlighted in Figure 3a and b. Error bars show bootstrapped 95% confidence intervals from the psychometric function fit. Solid lines show differences between PSEs at the p < 0.05 level, dashed lines show no significant difference. Participant labeled A1 is P.S. Blue bands delineate the data from each observer.

