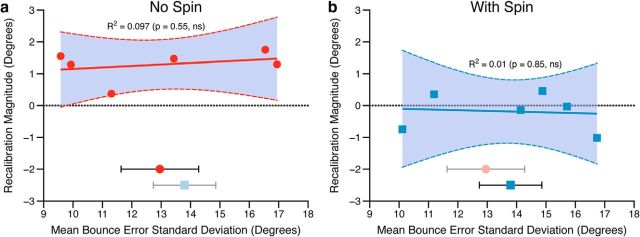
Figure 5.
The extent of individual observers' recalibration of slant as a function of their variability in the 3D kinematic game. The magnitude of recalibration is calculated as perceived slant after block 11 minus perceived slant after block 5 (just as in Fig. 4). This is plotted against the average SD of bounce errors in the ball game during the altered bounce phase of the experiment. This is shown for (a) the nonspinning ball group and (b) the spinning ball group. The solid line in both plots shows a least-squares linear fit to the data, with 95% confidence intervals of the fit shown with dashed lines (statistics of linear regression inset). The dotted horizontal lines show zero recalibration. In the lower part of both a and b the group mean bounce error SD during the altered bounce phase of the experiment is shown for both groups, with less opacity for the condition shown on each graph. Symbols for averages match those of the individual data. Error bars show SEM.

