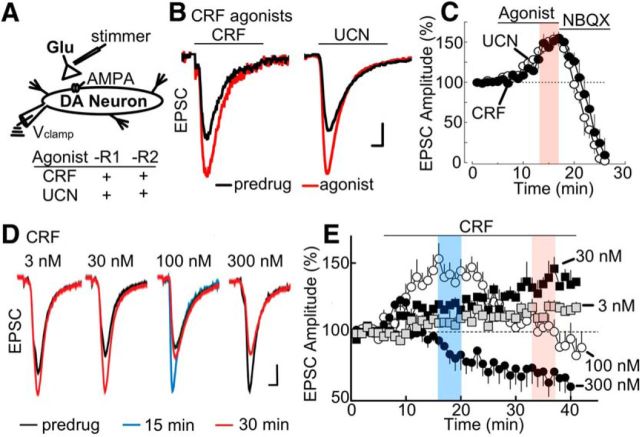
Figure 1.
CRF-R activation potentiates glutamate EPSCs in a concentration-dependent manner. A, Left, Simplified VTA circuit diagram. White triangles in this and later diagrams represent glutamatergic synaptic terminals. Recording and stimulus electrodes illustrate experimental configuration. Bottom, Summary table of the actions of CRF receptor agonists, CRF and UCN. B, Stimulus-evoked EPSCs were potentiated by application of CRF (left, 100 nm) or urocortin (UCN; right, 100 nm). Calibration: 100 pA, 1 ms. C, Summarized time course plot of EPSC amplitude (% of baseline, mean ± SEM) demonstrating potentiation of evoked EPSCs by CRF and UCN, as well as the inhibition by the AMPA receptor antagonist NBQX (5 μm). Sample size: CRF (n = 12 cells; 7 rats); UCN (n = 6 cells; 3 rats). The steady state of the potentiation produced by application of CRF-R agonists is highlighted in red. In this and in other plots, the amplitude of the evoked currents was normalized for each cell using the mean amplitude recorded during the first 5 min and plotted as function of time. D, Superimposed current traces showing concentration-dependent response of EPSCs to application of CRF at 3 nm (30–40 min), 30 nm (30–40 min), 100 nm (15–20 min), and 300 nm (30–40 min). Calibration: 100 pA, 1 ms. E, Summarized time course plot of EPSC amplitude (% of baseline, mean ± SEM) demonstrating bimodal concentration dependence of CRF on evoked EPSCs. Low concentrations of CRF (3 nm, 30 nm) potentiated evoked EPSCs, an effect that increased over the 40 min time period. Bath application of 100 nm CRF potentiated EPSCs during the early time period (0–20 min) but inhibited EPSCs during later time periods (30–40 min). A high dose of CRF (300 nm) showed an attenuation of EPSCs. In this and other plots, CRF was applied at 100 nm to evaluate both the “early” CRF potentiation (∼12–15 min of application, blue) and “late” CRF attenuation (∼20 min of application, red). E, Sample size for CRF experiments: 3 nm (n = 8 cells; 4 rats), 30 nm (n = 9 cells; 5 rats), 100 nm (n = 18 cells; 10 rats), and 300 nm (n = 14 cells; 7 rats).

