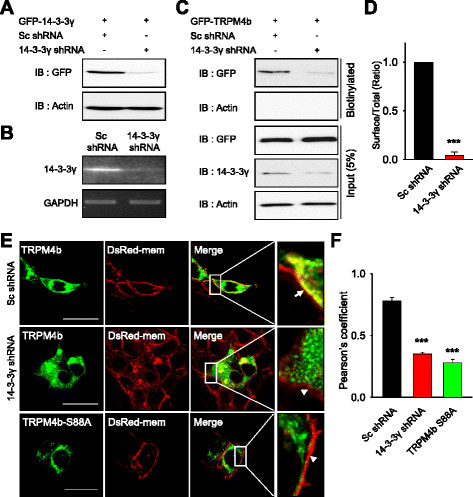
Figure 4.

The shRNA-mediated knockdown of 14-3-3γ reduced the surface expression of TRPM4b channels. (A) 14-3-3γ shRNA eliminated GFP-14-3-3γ proteins on the Western blot from HEK293T cells overexpressing GFP-14-3-3γ (GFP, upper panel). Actin was used as a normalized control. (B) 14-3-3γ shRNA reduced the level of 14-3-3γ mRNA in HEK293T cells as examined by RT-PCR. GAPDH was used as an internal control. (C) Surface biotinylation experiment was performed from HEK293T cells expressing GFP-TRPM4b with Scrambled (Sc) or 14-3-3γ shRNA. The knockdown of 14-3-3γ markedly decreased cell surface expression of TRPM4b. (D) Summary bar graph of TRPM4b level with Sc or 14-3-3γ shRNAs co-expression was shown as a ratio of surface to total TRPM4b (n = 4). (E) GFP-TRPM4b was co-transfected with Sc shRNA (upper panel) or 14-3-3γ shRNA (middle panel) in HEK293T cells with DsRed-Mem, a plasma membrane marker. Intracellular localization of GFP-TRPM4b was visualized by confocal microscopy (left panels). GFP-TRPM4b-S88A was also shown in (bottom panel). Merged images were shown (right panel) and plasma membranes were indicated by an arrow and arrowheads in enlarged image. Scale bars, 10 μm. (F) The Pearson’s correlation coefficient for TRPM4b with 14-3-3γ shRNA or TRPM4b-S88A was significantly less than values obtained with Sc shRNA in HEK293T cells (P < 0.001). The Pearson’s correlation coefficient denoting covariance of fluorescence signals was calculated using Nikon A1 software.
