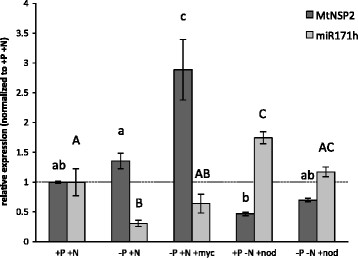
Figure 2.

Relative expression levels of mature miR171h and NSP2 transcripts in M. truncatula roots. -P: 20 μM phosphate, +P: 1 mM phosphate, −N: 0 mM; +N 5 mM nitrate fertilization, myc: mycorrhizal roots, nod: nodulated by Sinorhizobium meliloti. Plants were harvested 3 wpi. Normalization of the expression data was carried out against a reference gene index (MtPdf2 and MtEf1) and the resulting relative expression was normalized to full nutrition condition (+P + N). Data shown are average values of 3–4 biological with two technical replicates each. Error bars indicate the standard errors. Different letters indicate statistical different values (P < 0.05, two-way ANOVA with Holm-Sidak multiple comparison).
