
Figure 3.
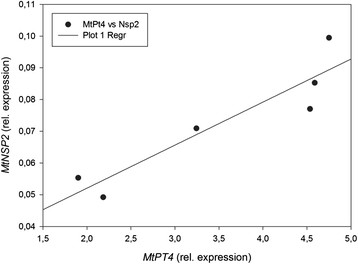
The relative transcript abundance of NSP2 positively correlates with MtPt4. Scatter plot of the relative expression of NSP2 against the relative expression of MtPt4 of individual WT plants including a linear regression (black line). A statistically significant correlation was calculated (r = 0.927, P <0.01, Pearson product moment correlation). All plants were harvested 4 wpi. Normalization of the expression data was carried out against a reference gene index (MtPdf2 and MtEf1).