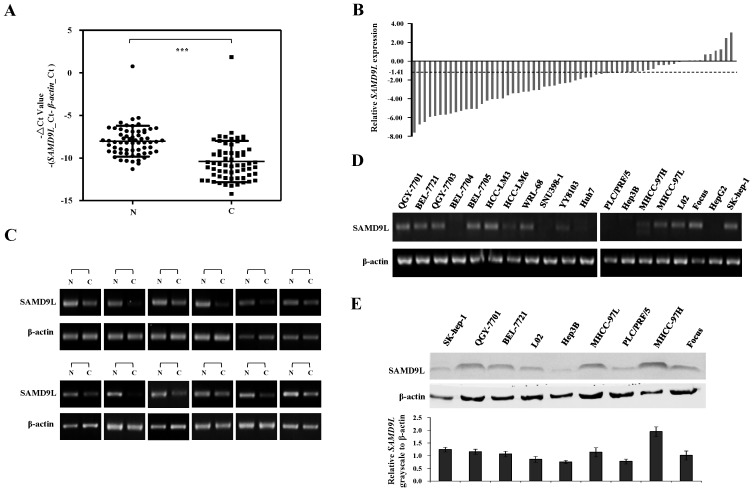
Figure 2.
Expression analysis of SAMD9L in HCC tissues and cell lines. (A-B) Transcript level of SAMD9L was measured in 62 HCC specimens and their adjacent non-cancerous livers by quantitative RT-PCR. The relative mRNA level of SAMD9L was normalized based on that of an internal reference β-actin. Each plotting dot indicates the expression level of a given HCC specimen or adjacent liver tissue and lines represent the median with standard deviation of -△Ct value. P value was calculated by student's t test. N, adjacent non-cancerous livers; C, HCC specimens. ***, P < 0.001. (B) Relative expression of SAMD9L mRNA for the 62 HCC specimens as compared to their adjacent non-cancerous livers. (C) Representative results of semi-quantitative RT-PCR of SAMD9L from 12 paired samples of HCC patients. (D) The transcript level of SAMD9L was measured in 19 HCC cell lines using quantitative PCR, where β-actin was used as internal reference. (E) SAMD9L expression was evaluated in some available HCC cell lines by Western blotting assay. The grayscale intensities of western blots were measured and β-actin was used as a normalization control. Data shown are representative of three independent experiments.

