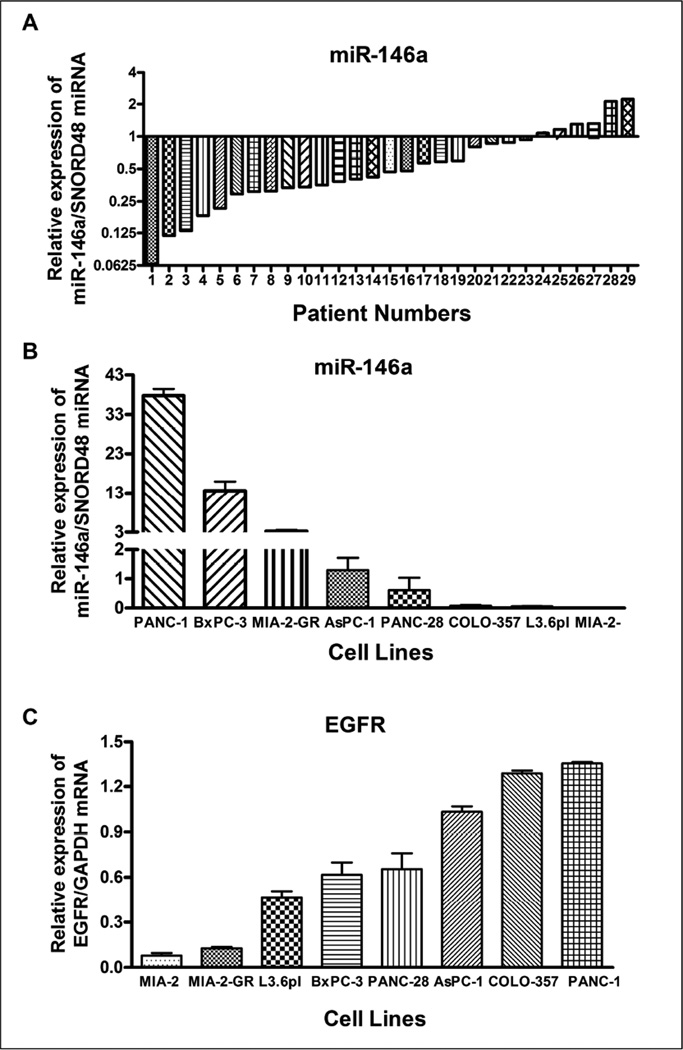
Figure 1.
Comparative expression analysis of miR-146a in 29 FNA cell blocks from PC patients individually compared to 15 normal controls using qRT-PCR. 1.0 represents average of normal subjects (n=15). There was a significant down-regulation of miR-146a in most of the 29 PC patients compared to normal subjects (A). Basal levels of miR-146a expression (B) and EGFR expression (C) in human PC cell lines AsPC-1, BxPC-3, COLO-357, L3.6pl, MIAPaCa-2 (MIA-2), MIAPaCa-2-GR (MIA-2-GR), PANC-1 and PANC-28. The miR-146a expression was significantly lower in PC cells and was normalized using SNORD48 miRNA, whereas EGFR expression was higher and was normalized using GAPDH mRNA as assessed by qRT-PCR.

