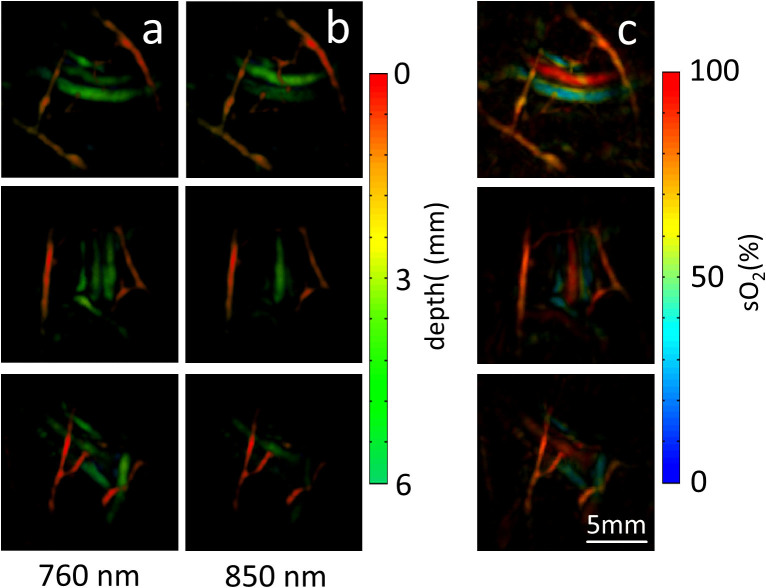
Figure 3. Optoacoustic images of tissue vasculature in a healthy volunteer acquired using the three-dimensional handheld probe and the developed microsecond delay approach.
(a) Volumetric images at 760 nm color-coded for depth. (b) The corresponding images at 850 nm. (c) Blood oxygen saturation maps (maximum intensity projections along the depth direction) derived by spectral unmixing of the multispectral data. The scalebar corresponds to 5 mm.

