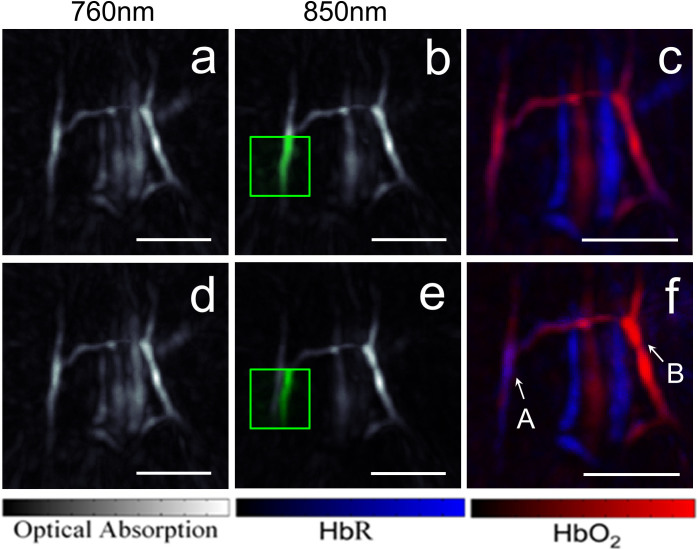
Figure 5.
Maximum intensity projections of the images acquired with two laser pulses separated by 17 μs (a–b) and the corresponding image representing the unmixed distributions of oxygenated and deoxygenated haemoglobin (c). The corresponding images acquired with two adjacent laser pulses separated by approximately 100 ms are shown in (d–f). Part of the image data in (a) and (d) is superimposed in green into the areas marked with the green squares in (b) and (e). Maximum intensity projections along the depth direction are shown. The scalebar corresponds to 5 mm.

