. 2014 Jul 30;4:5887. doi: 10.1038/srep05887
Copyright © 2014, Macmillan Publishers Limited. All rights reserved
This work is licensed under a Creative Commons Attribution 4.0 International License. The images or other third party material in this article are included in the article's Creative Commons license, unless indicated otherwise in the credit line; if the material is not included under the Creative Commons license, users will need to obtain permission from the license holder in order to reproduce the material. To view a copy of this license, visit http://creativecommons.org/licenses/by/4.0/
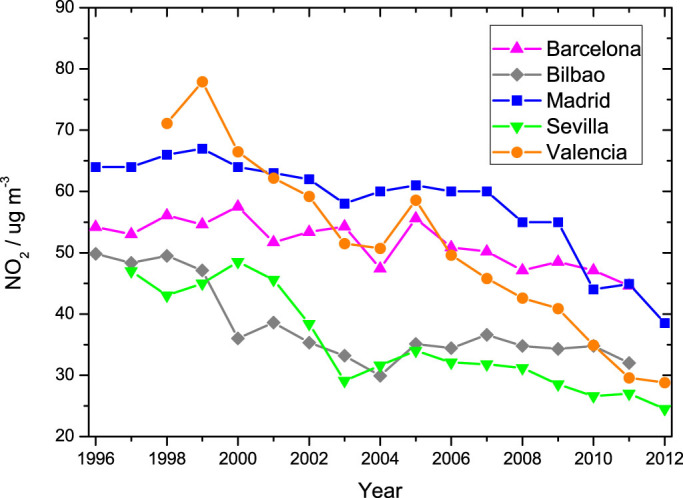
Figure 3. NO2 annual averages from air quality monitoring stations.

