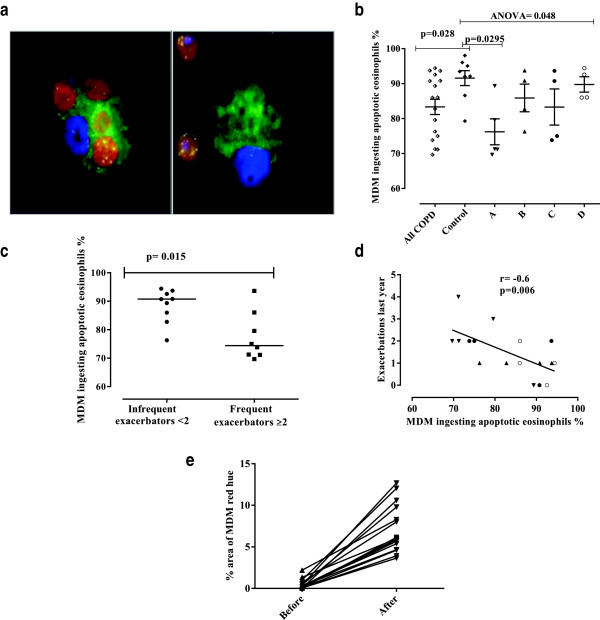
Figure 3.

Monocyte–derived macrophages efferocytosis of eosinophils. a) Representative immunofluorescence staining of macrophages cultured with apoptotic eosinophils. Macrophages were stained with CD68-FITC (green), ECP-PE (red) and DAPI (blue). Left panel shows efferocytosis of eosinophils by a macrophage positively stained with ECP and the right panel shows ECP positive eosinophils and a macrophage with no evidence of efferocytosis. b) Comparison of macrophage efferocytosis of eosinophils in the 4 COPD groups and normal controls. The horizontal bars represent the median. c) Dot-plot of macrophage efferocytosis of eosinophils in those subjects with or without frequent exacerbations (≥2 exacerbations/year). Horizontal bars are medians. d) Scatter blot demonstrating the inverse correlation between the efferocytosis of eosinophils by macrophages and the frequency of exacerbations. Group A: triangles pointed down, B: triangles pointed up, C: closed circles, D: open circles. e) MDM % red hue from stained cytospins before and after eosinophil feeding for both COPD and normal subjects. Arrows represent medians of percentage area of red hue for each subject.
