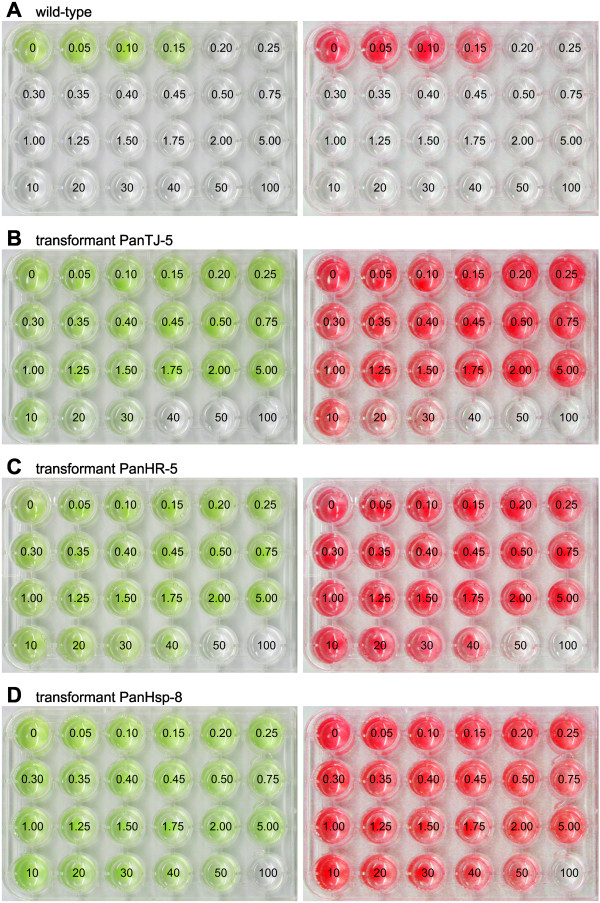
Figure 2.

Analysis of paromomycin resistance in wild-type and transgenic P. morum strains. For detailed analysis of resistance, identical quantities of P. morum cells were exposed to increasing concentrations of paromomycin, and incubated for 10 days. Numbers refer to the concentration of paromomycin [μg/ml] utilized. Natural color (left) and red-shifted, false-color images (right) are shown. (A) The wild-type P. morum strain. (B-D) Transgenic P. morum strains co-transformed with pPmr3, the selectable marker plasmid, in addition to a second, non-selectable reporter gene plasmid. (B) Transformant PanTJ-5 was co-transformed with the plasmids pPmr3 and pPsaD-GLuc. (C) Transformant PanHR-5 was co-transformed with the plasmids pPmr3 and pHRLucP. (D) Transformant PanHsp-8 was co-transformed with the plasmids pPmr3 and pHsp70A-GLuc.
