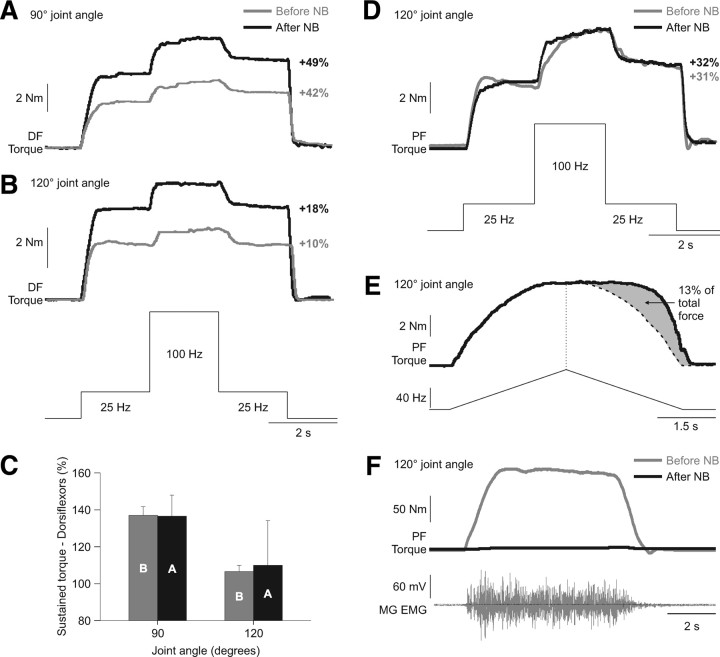
Figure 11.
Extra torques before and after nerve block in two human subjects. A, B, Torques evoked by dorsiflexor (DF) top hat stimulations (25, 100, and 25 Hz) at ankle joint angles of 90° and 120°, before and after a lidocaine nerve block (NB) of the common peroneal nerve in subject 1. C, Average ± SD of three trials before (B) and after (A) nerve block at ankle joint angles of 90° and 120° for subject 1. D, Torques evoked by plantarflexor (PF) top hat stimulations (25, 100, and 25 Hz) at an ankle joint angle of 120°, before and after a lidocaine nerve block of the tibial nerve in subject 2. E, Torque produced by stimulating the plantarflexor muscles with a triangular frequency ramp from 4 to 80 Hz and back down to 4 Hz in a 6 s period at a joint angle of 120° for subject 2 after nerve block. The dotted vertical line represent the point of stimulation at 80 Hz and the curved dotted line represents a smoothed hypothetical symmetric torque profile on the descending slope of the frequency ramp. The gray area illustrates the extra torque, which is expressed as a percentage of the total torque. F, The torque and EMG of the MG produced during a maximal voluntary effort of the plantarflexors before and after nerve block in subject 2. The percentage increase in the extra torque (i.e., the torque produced during second the 25 Hz stimulation expressed as a percentage of the first 25 Hz stimulation) is shown on the right for each joint angle in A, B, and D.

