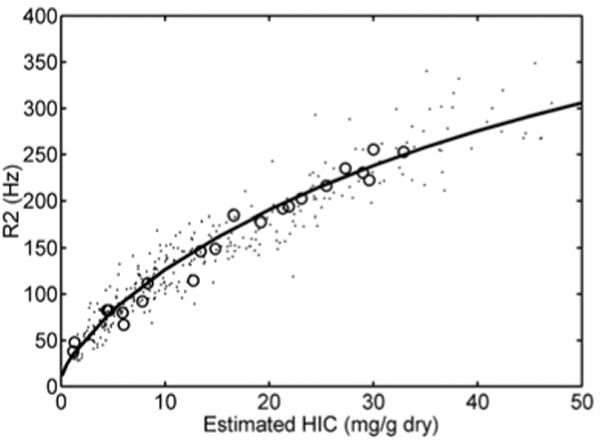
Figure 1.

Scattergram of liver R2 as a function of LIC by biopsy (open circles), or by liver R2* (dots)[38, 69]. Solid line represents the calibration curve originally published by St Pierre[37], et al, not a fit to the data. Despite significant differences in scanner hardware, image acquisition, and post-processing techniques between the two laboratories, the overall agreement is excellent.
