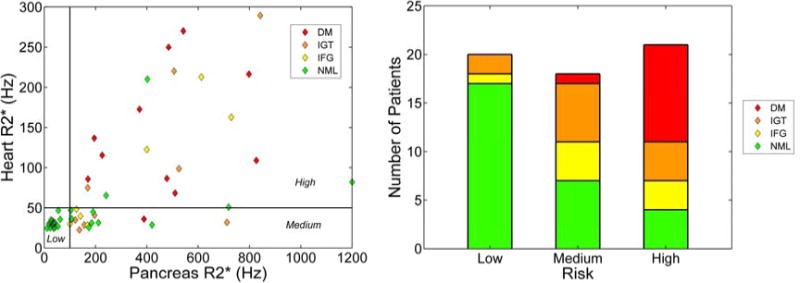
Figure 5.

(Left) Plot of heart R2* versus pancreas R2*[55]. Horizontal line at 50 Hz indicates the threshold of detectable heart iron. Vertical line at 100 Hz represents a risk threshold for pancreas R2*. Color of each diamond represents the outcome of an oral glucose tolerance test. Normal heart and normal pancreas represents low risk. Normal heart with abnormal pancreas represents medium risk. When both organs have iron overload, the patient is considered high risk. (Right) Results of OGTT test as a function of risk threshold[55].
