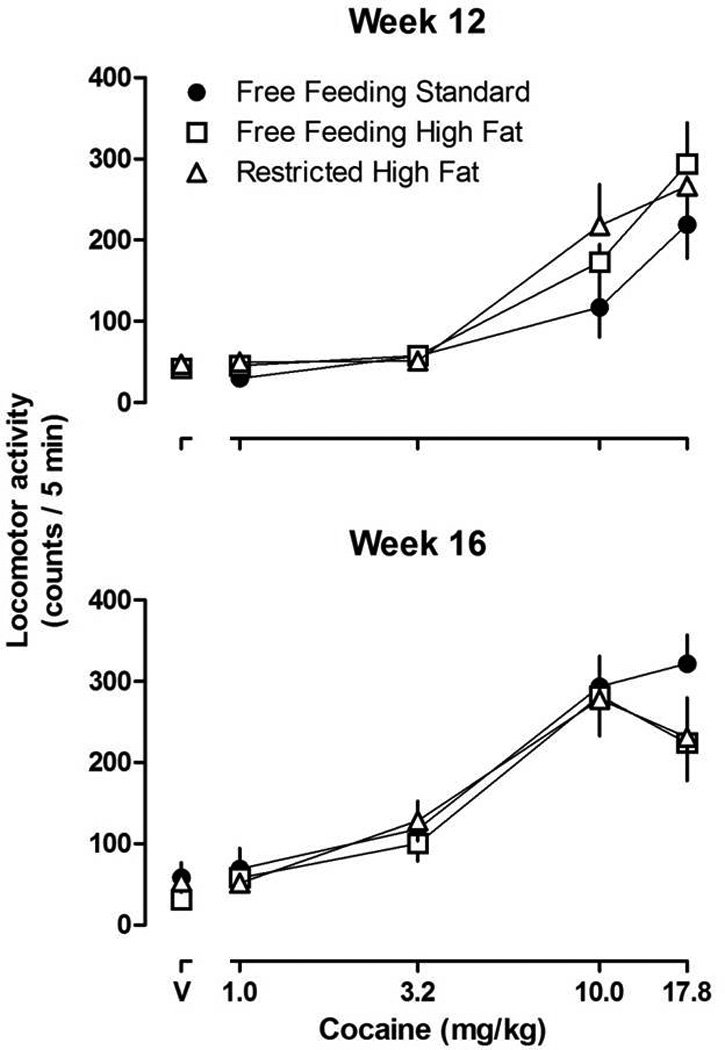
Figure 5.

Locomotor activity counts/5 min period after the administration of cocaine in female rats that had eaten standard or high fat chow for 12 or 16 weeks (upper and lower panels, respectively). Vertical axes: mean ± SEM locomotor activity counts / 5 min period. Horizontal axes: dose of cocaine in mg/kg body weight (V = vehicle).
