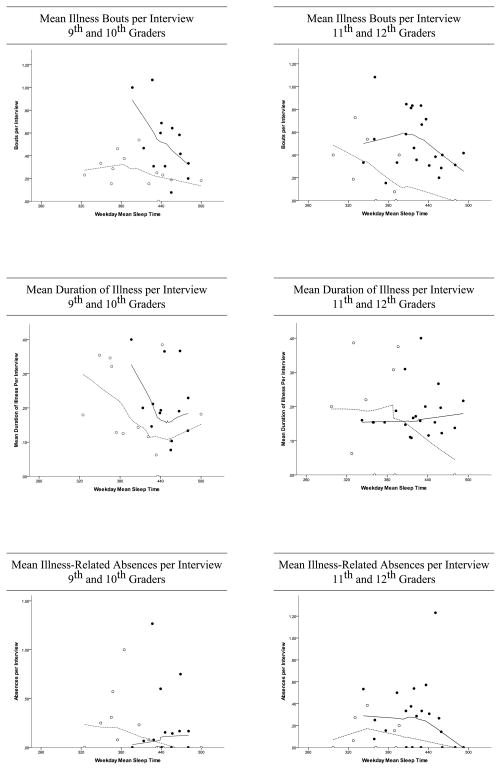
Figure 1.
Mean illness bouts, mean duration of illness, and mean illness-related absences by sex and academic level, with mean weeknight total sleep time from January to May shown as a continuous variable. The left-hand graph shows 9th/10th graders, while the right-hand graph shows 11th/12th graders. Open circles represent males, and filled circles represent females. Dotted lines show a line of best fit for males, while solid lines show a line of best fit for females.

