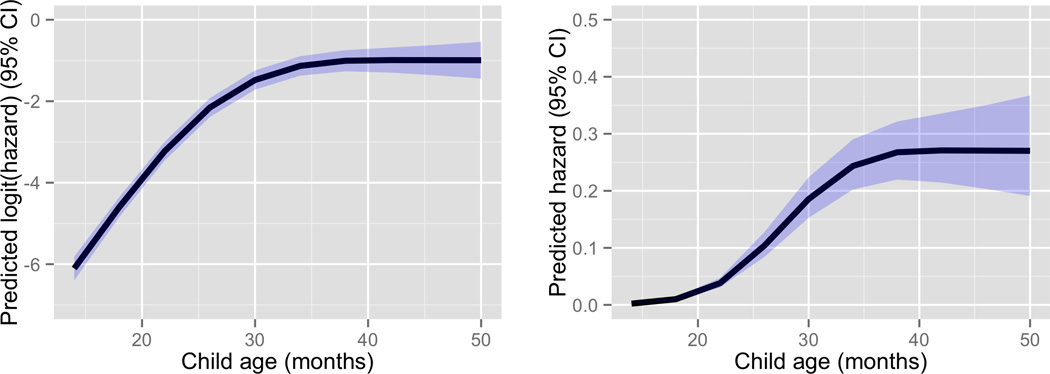
Figure 4.

Predicted overall hazard function, shown in logit space (left) and probability space (right). Solid line and shading are the predicted hazard (with all predictors besides child age held at their mean values), and its 95% confidence interval.
