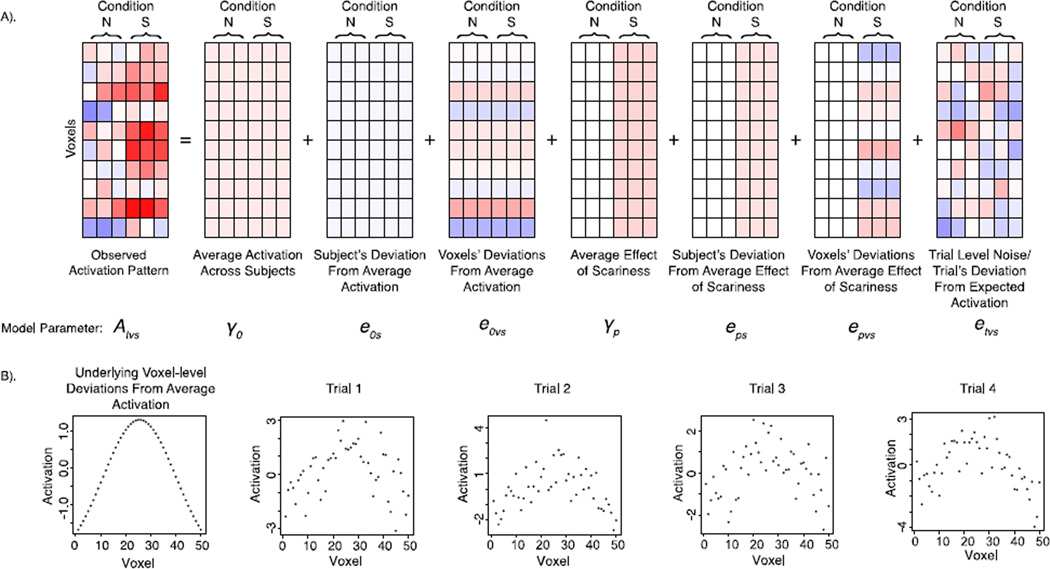
Figure 4.
(A) A graphical depiction of the 3-level mixed model for simulating fMRI data (Figure 2). Each level of the mixed model (subject, voxel, and trial) contributes variability to the observed trial-wise activation patterns. This example depicts a case in which a dummy coded scariness variable (Not Scary (N) = 0; Scary (S) = 1) is included, and thus trials for scary stimuli receive an added fixed effect of S in addition to added subject-level and voxel-level random deviations from the fixed effect of S. (B) A graphical depiction of how spatial variability in mean/baseline activation persists over repeated trials and is not influenced by centering with respect to the mean activation across voxels (e.g., Baseline Variability Simulation). In this example, mean activation in individual voxels tends to decrease as a function of distance from the peak voxel in the region-of-interest (ROI), such that across trials the central voxels tend to have the highest signal, whereas the outside voxels have a lower signal. Such an effect may arise as a function of distance-to-capillary or any other anatomical differences that create reliable variability in signal across voxels. The pattern caused by voxel-level variability persists across trials and is not eliminated by centering with respect to the mean activation across voxels because the ROI mean does not include information about the voxel-wise deviations.

