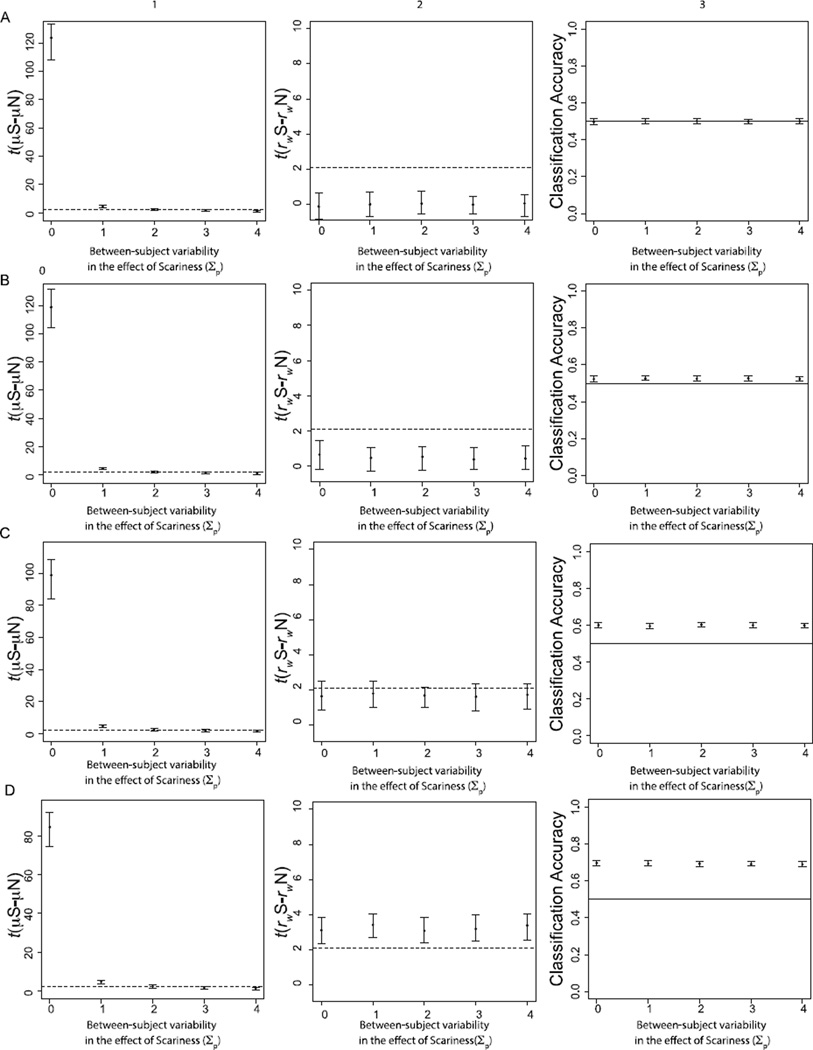
Figure 7.
Results from Subject-level Variability Simulation. Column 1 depicts group-level t-tests for the mean effect of scariness. Column 2 depicts group-level t-tests for the difference in within-condition correlations between scary and not-scary stimuli. Column 3 indicates classification accuracy for linear SVMs trained to classify activation patterns of scary and not-scary stimuli. The dotted lines in the t-test figures reflect the minimum t needed for statistical significance. The black lines in the SVM analysis depict chance classification (50%). Rows correspond to different levels of voxel-level variability in the effect of memory (A = 0.01; B = 0.1; C = 0.2; D = 0.3).

