
Figure 1.
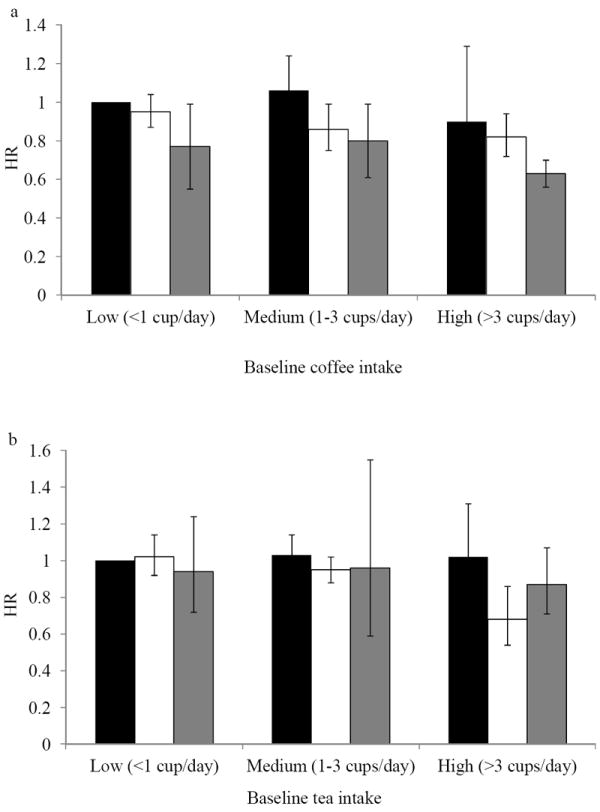
Hazard ratios (and 95% confidence intervals) for type 2 diabetes according to updated 4-year changes in coffee (a) and tea intake (b). Low intake level was defined as less than 1 cup per day; medium intake, 1-3 cups per day; and high intake, >3 cups per day. The vertical bars represent coffee or tea consumption 4 years later – black bars indicate low intake (<1 cup per day), white bars indicate medium intake (1-3 cups per day), and grey bars indicate high intake (>3 cups per day). The reference group (hazard ratio, 1.00) was the low intake level at both baseline and the 4-year follow up visits. The results across the 3 cohorts were pooled using an inverse variance-weighted, random-effects meta-analysis.