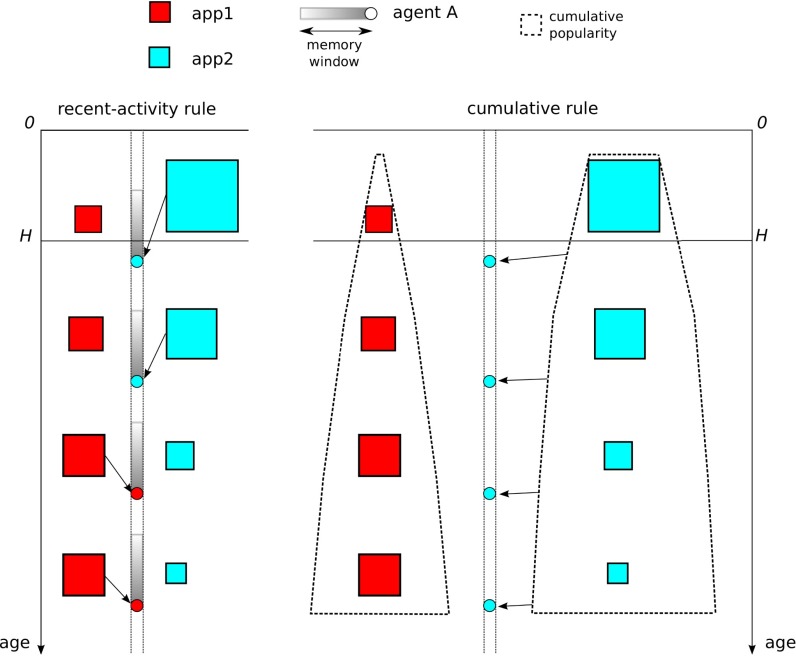
Fig. 2.
Schematic of the model. The squares indicate the number of installations at time t of two example apps; their size represents the number of installations of an app in a particular hour. The circles represent agents, and the arrows indicate the adoption of an app. In the history window (ages 0 to H), we copy the installation history directly from the data. Outside of the history windows, we simulate the actions of F(t) agents by assigning probabilistic rules for how they choose which app to install. An agent who uses (Left) the recent-activity rule at a given time copies the choice of an agent who acted in the recent past, so apps that were recently more popular are more likely to be chosen. By contrast, an agent who uses (Right) the cumulative rule at a given time installs the app with the larger number of accumulated installations. We represent this cumulative popularity using the dashed contour, which increases in width with time as more installations occur.

