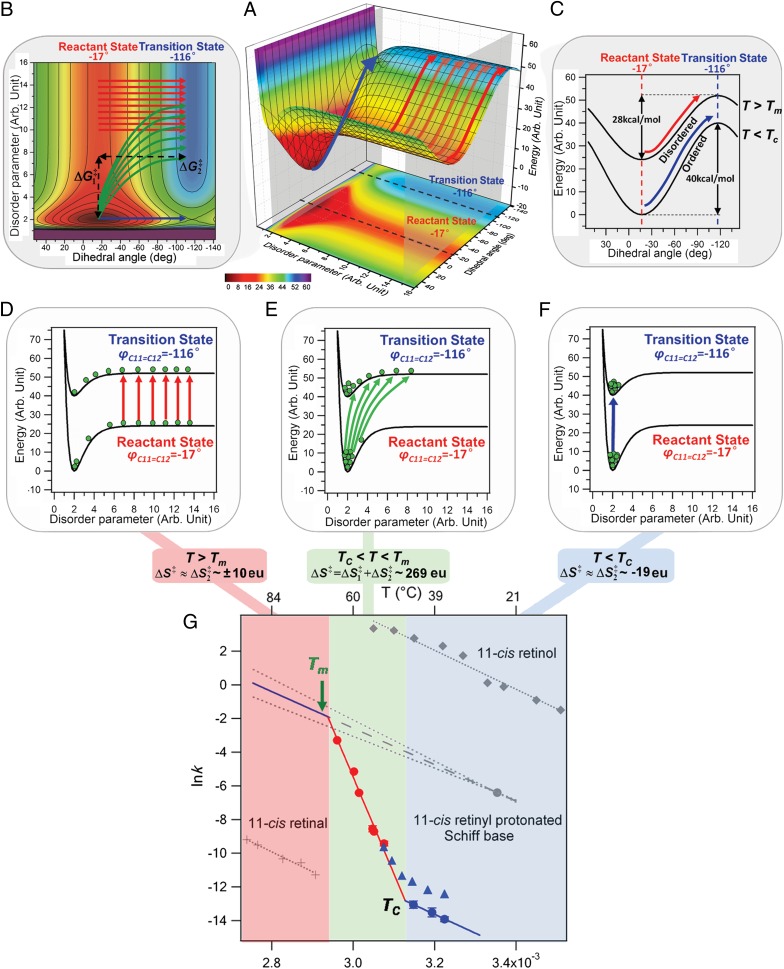
Fig. 5.
(A) Schematic energy surface. Energy is plotted vs. the disordering parameter (the degree of disordering of H-bonds) and the dihedral angle between the C11–C12 double bond (−17° is the reactant state, and −116° is the transition state from the QM/MM calculation as shown in SI Text). (B) Energy contour plot and the two steps for calculating: disordering of H-bonds (ΔG1‡) and isomerization of 11-cis retinyl chromophore (ΔG2‡). (C) Energy curves corresponding to the two intersection planes in the energy plots for the path at low temperature (blue arrows) with higher, and the path at high temperature (red arrows) with lower. Boltzmann distribution (green balls) at the reactant and transition states for (D) T > Tm with ∼±10 eu following the red paths, (E) TC < T < Tm with ∼269 eu following the numerous green paths, and (F) T < TC with ∼−19 eu following the blue path. (G) Arrhenius plots spanning three temperature regions, including kinetic data obtained by Janz and Farrnes (11) (blue triangles), in our experiments (red and blue dots), the isomerization of 11-cis retinal (33) (gray cross), 11-cis retinol (34) (gray diamonds), and 11-cis retinyl PSB (28) (gray dots) (n ≥ 3; error bars represent the SD).

