Fig. 3.
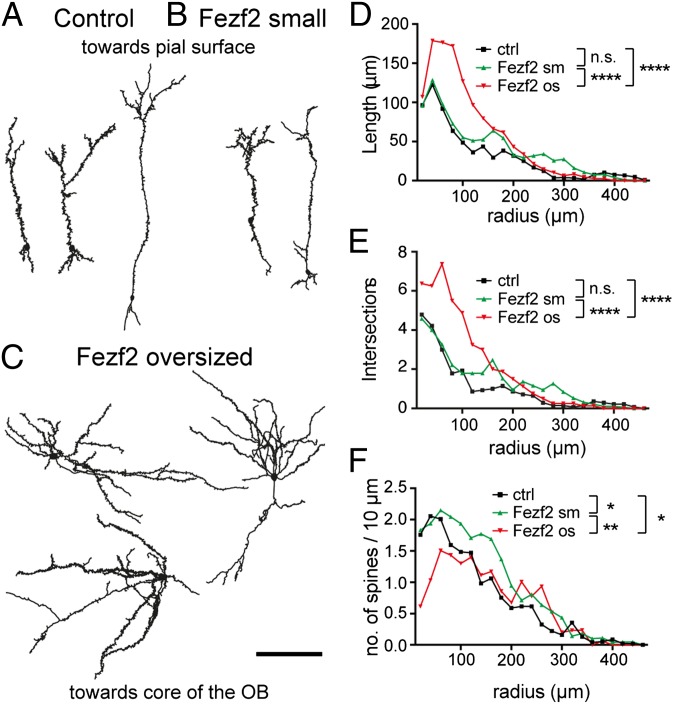
Oversized Fezf2+ cells display a more elaborate dendritic morphology. Representative camera lucida drawings of biocytin-filled control bulbar granule cells (A), small Fezf2+ cells (B), and respecified Fezf2+ cells (C) more than 3 wpi of the viral mix in P4 mice. (Scale bar: 100 μm.) Sholl analysis of the cell process length shows significant differences in the length of dendrites (D) and intersections of cell processes (E) (two-way ANOVA with a Bonferroni multiple comparison test). (F) Number of dendritic spines normalized to the corresponding cell process length (spine density) (two-way ANOVA with a Bonferroni multiple comparison test). Error bars were omitted for clarity, and data points indicate means (n = 14/6 cells/mice for control (ctrl), n = 19/9 cells/mice for Fezf2 small (sm), and n = 8/8 cells/mice for Fezf2 os. *P < 0.05; **P <0.01; ****P < 0.0001; n.s., not significant.

