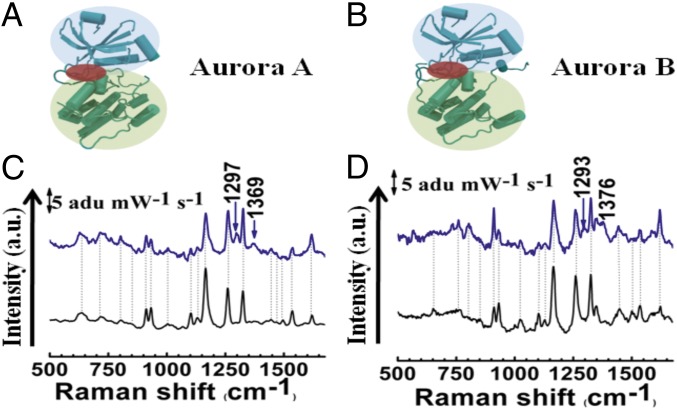
Fig. 3.
SERS study of competitive inhibition of Aurora A and B by Reversine. A and B show the structure of Aurora A and B, respectively. The N-terminal β-sheet–rich domain and the C-terminal α-helix–rich domains are highlighted in blue and green, respectively. The ATP binding region where reversine binds is highlighted in red. (C) SERS spectra of Aurora A (black) and Aurora A–reversine complex (blue). (D) SERS spectra of Aurora B (black) and Aurora B–reversine complex (red). New modes are indicated by arrows.

