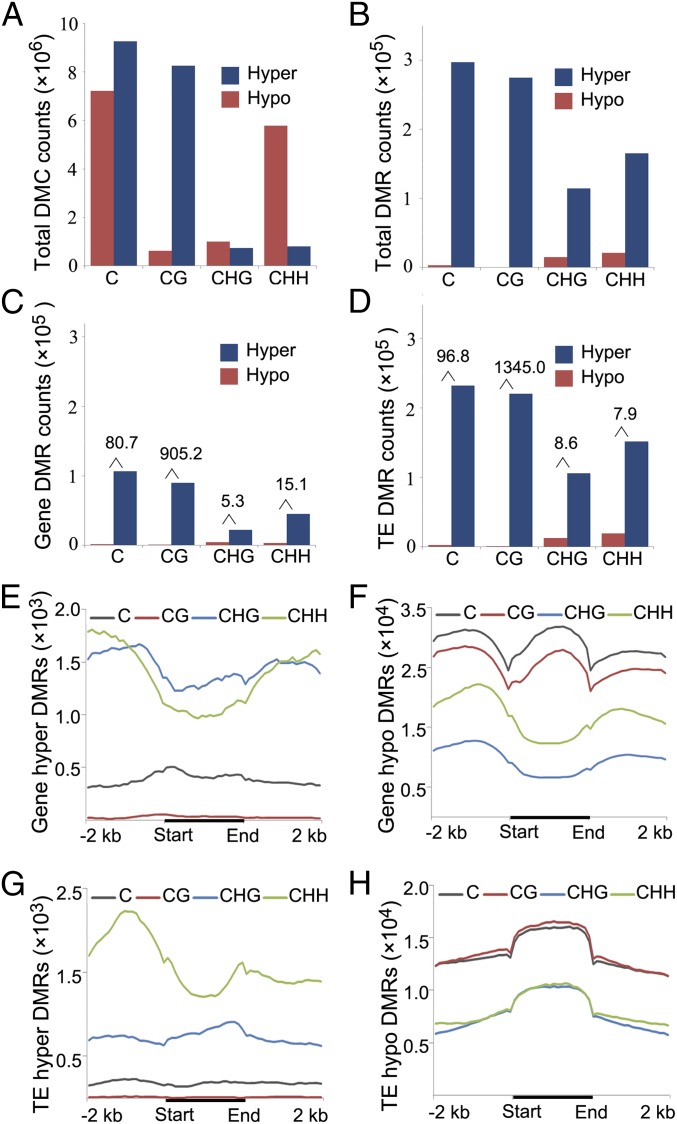
Fig. 3.
Statistics of differentially methylated cytosines and differentially methylated regions between OsMET1-2−/− and WT (+/+). (A and B) Hyper- or hypomethylation DMCs and DMRs that occurred in all three cytosine contexts (for DMRs, a window size of 1 kb was adopted). (C and D) Enrichment of hyper- or hypomethylation DMRs in genes and TEs, respectively. The numbers above the columns represent the value of hypo-DMRs vs. hyper-DMRs. (E–H) Distribution of hyper- or hypomethylation DMRs along the body region, and their up- or downstream 2-kb flanks in protein-coding genes and TEs.

