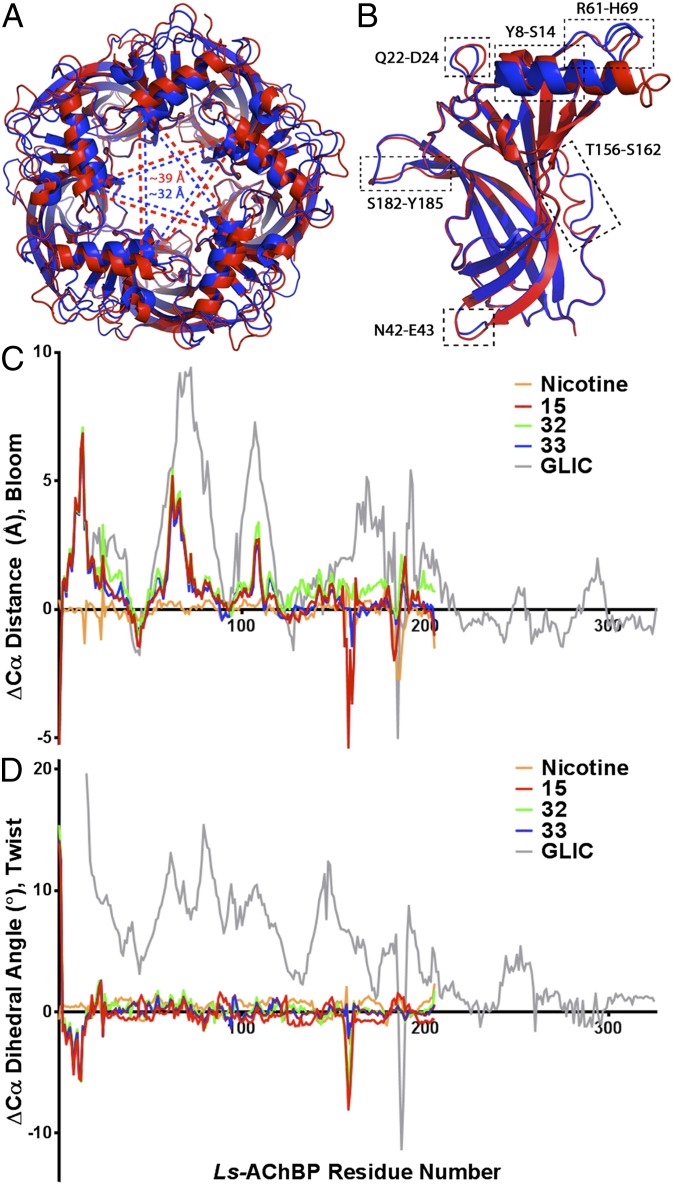
Fig. 4.
Global differences in X-ray crystal structures of Ls-AChBP bound cooperative ligands in comparison with crystal structure of Ls-AChBP in its Apo form (PDB code 1UX2) and GLIC (PDB code 4NPP). (A) Top (apical) view on superimposed (UCSF chimera) Apo pentamer (in blue) and with bound 15 (in red). Dashed lines (blue and red, respectively) indicate the most significant differences in quaternary structures quantified by measuring distances between T13 backbone α carbon of distant subunits. (B) Superimposition (PyMOL) of Ls-AChBP Apo, chain D (in blue) and 15 complex, chain D (in red). Major differences in the quaternary structures of the AChBP are marked with dashed rectangles (RMS value of ∼0.5 or greater). (C) Chart of differences of Cα distances (n = 5) of diametrical subunits observed in cooperative ligands relative to Apo in comparison with GLIC (GLIC, closed form, is used as a reference). Nicotine used as a control. Observed differences reflect blooming profile of the protein complexes. (D) Plot of differences of Cα dihedral angles (n = 5) observed in cooperative ligands relative to Apo in comparison with GLIC (GLIC closed form used as a reference). Nicotine used as a control. Observed differences reflect twisting profile of the protein complex.

