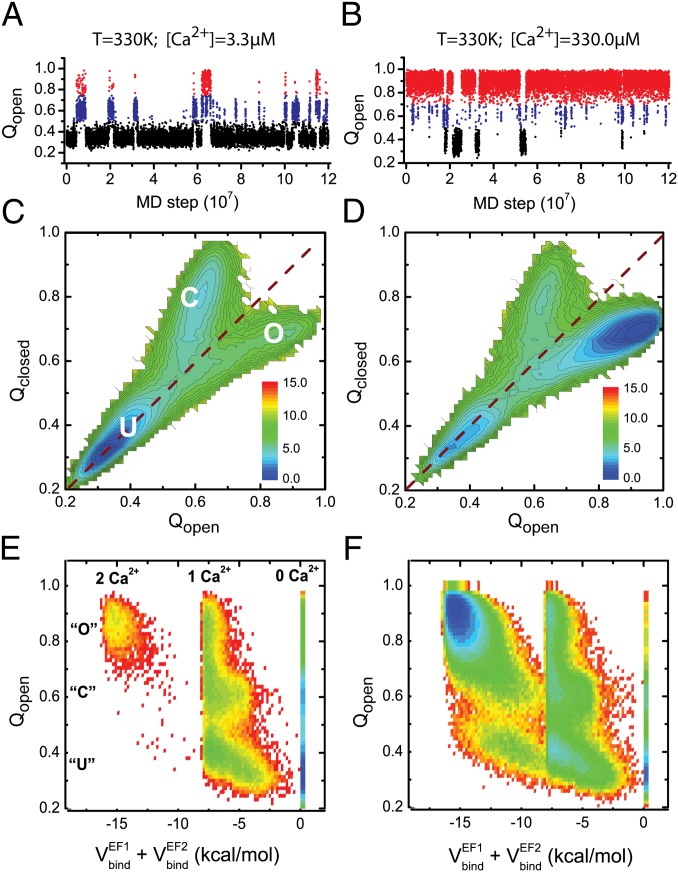
Fig. 3.
(A and B) Representative trajectories for the isolated CaM-C monitored by Qopen for the simulations at 330 K with Ca2+ concentrations of 3.3 μM (A) and 330.0 μM (B). (C and D) Free energy profiles of the isolated CaM-C on the reaction coordinates Qopen and Qclosed at 330 K with Ca2+ concentrations of 3.3 μM (C) and 330.0 μM (D). The dashed lines correspond to the diagonal line of the 2D free energy surfaces. (E and F) Free energy profiles projected on the reaction coordinates Qopen and total binding energy of the two binding sites with Ca2+ concentration of 3.3 μM (E) and 330.0 μM (F) at 330 K for the CaM-C. The unit of the free energy is kBT.

