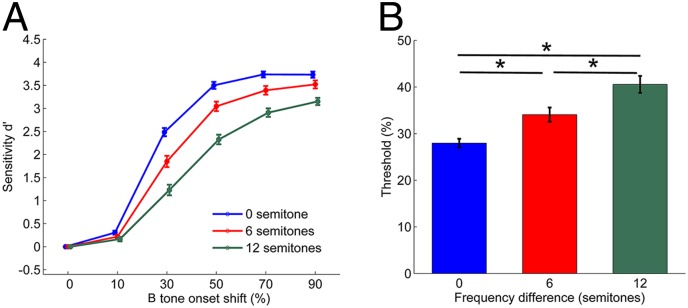
Fig. 1.

Average psychometric functions and time shift detection thresholds. (A) Average psychometric function in relation to Δf. The onset time shift of the B tone is represented as a percentage of the 40-ms tone duration. Sixty-four experiments were conducted in four birds for each Δf condition. Error bars represent ± SEM. (B) Average behavioral threshold for B tone time shift detection. Threshold values (50% reaction point) were calculated by fitting the psychometric functions relating percent response to the time shift with a single logistic function to the data for each Δf condition in the set of 64 experiments. *Represents a significant difference (P < 0.001). Error bars represent ± SEM. Data were pooled across subjects that showed no significant differences in response probability or sensitivity.
