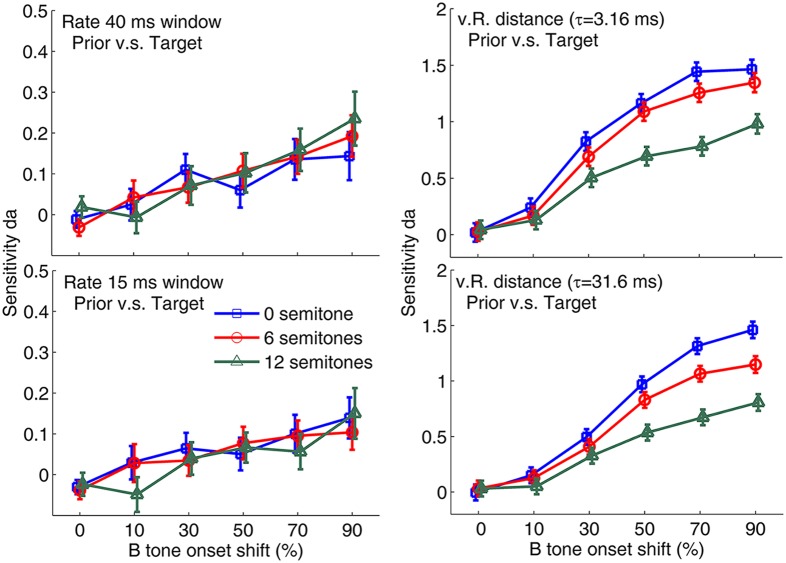
Fig. 3.
Average neurometric functions based on response rate (Left) and vR distance (Right) representing the response to the time shift of the B tone. A total of 64 experiments were conducted in four birds for each semitone condition. Rate analysis was performed using two different time-shifted windows, 40 ms (Upper) and 15 ms (Lower). The time shift of the window was always matched to the B tone onset shift. The reference distribution was the same as for previous triplet responses. The vR distance was determined using two different time constants, 3.16 ms (Upper) and 31.6 ms (Lower). Error bars represent ± SEM.

