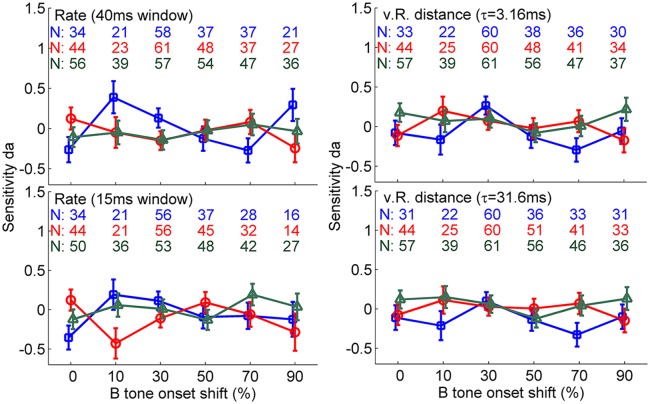
Fig. 4.
Average neurometric functions based on response rate (Left) and vR distance (Right) representing the decision-related response. Rate analysis was performed using two different time-shifted windows, 40 ms (Upper) and 15 ms (Lower). vR distance was determined using two different time constants, 3.16 ms (Upper) and 31.6 ms (Lower). The sensitivity measure, da, results from a comparison of neuronal responses in trials with a hit and trials with a miss presenting the same stimuli. The blue, red, and green lines represent Δf’s of 0, 6, and 12 semitones, respectively. Each colored number represents the number of recording sites for the corresponding data point. Error bars represent ± SEM.

