
Fig. 2.
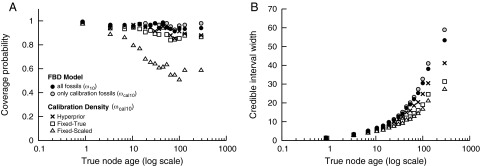
The results for 100 replicate trees simulated under the FBD model with μ/λ = 0.5, λ − μ = 0.01. Node age estimates are summarized for analyses under the FBD model by using all available fossils sampled randomly (10%; ω10) from the total number of simulated fossils (●). These results are compared with divergence time estimates on the set of calibration fossils (ωcal10) under the FBD model ( ), with a hyperprior on calibration density parameters (×), with a fixed calibration density where the expected value is equal to the true node age (□), and for a fixed calibration density scaled based on the age of the fossil (△). Both the coverage probability and precision (95% CI width) are shown as a function of the true node age (log scale), where the nodes were binned so that each bin contained 150 nodes and the statistics were computed within each bin. (A) The coverage probability is the proportion of nodes in which the true value falls within the 95% CI. (B) The average size of the 95% CIs for each bin was computed to evaluate precision.