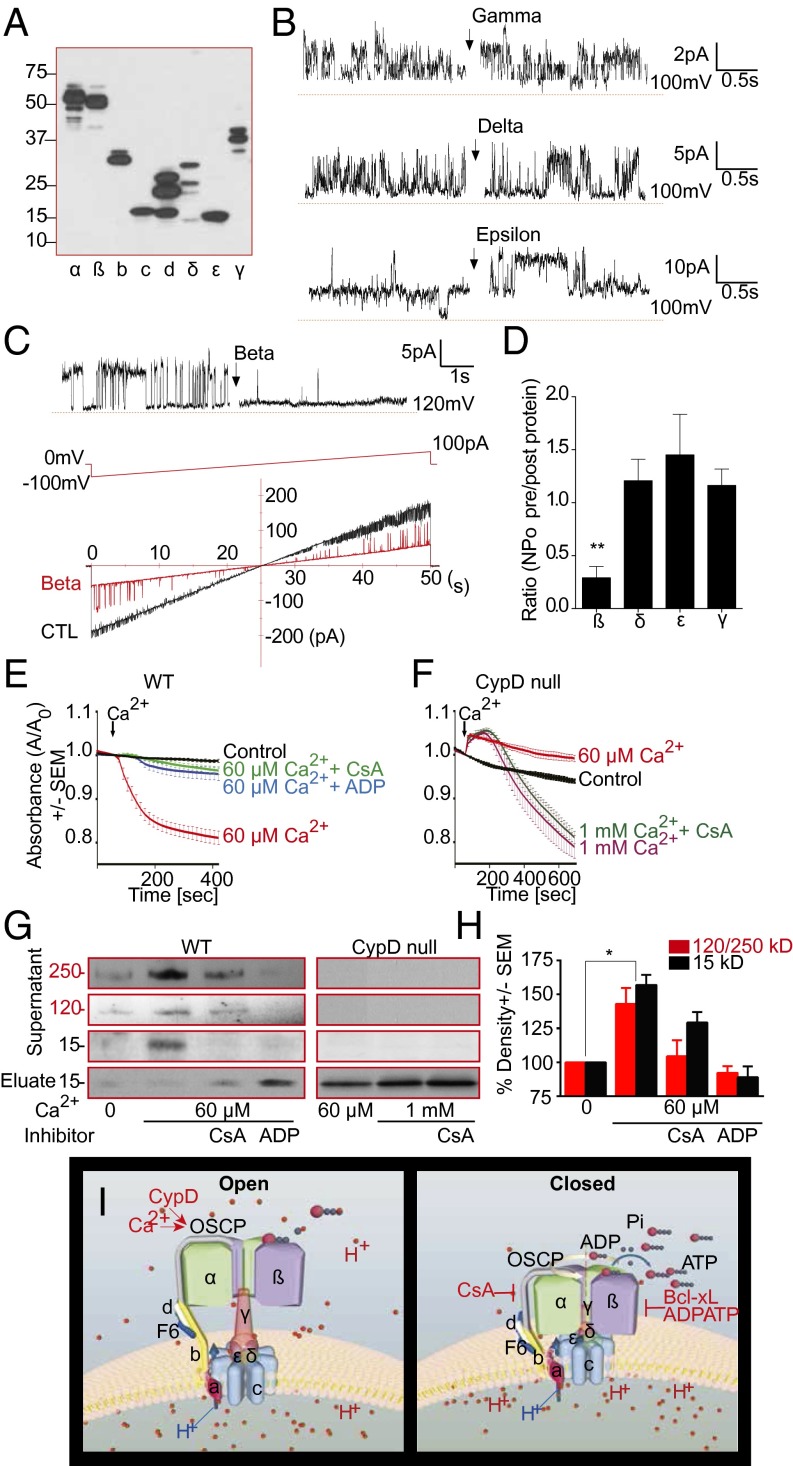
Fig. 5.
Structural rearrangements of ATP synthase unmask the c-subunit pore. (A) Immunoblot using antibody against mammalian myc/FLAG-tagged human ATP synthase subunit proteins (blot representative of 3 blots). (B and C) Representative proteoliposome patch clamp recordings of purified c-subunit. Purified gamma, delta, epsilon or beta-subunit (50 ng/µL recording solution) were added (arrow). (C, Lower) Ramp voltage recording. (D) NPO ratio after/before addition of indicated ATP synthase subunits (n = 5, **P = 0.0036). (E and F) Ca2+-induced IMM swelling assay of WT heart or CypD KO mitochondria in 200 nM CsA or 0.5 mM ADP. Plotted is ratio of absorbance at 540 nm (A) after/before Ca2+ (n ≥ 3 each). (G) Immunoblots (ATP5G-com or ATP5G1) of the supernatants and eluates after ATP synthase IP from WT and CypD KO mitochondrial lysates, as in E and F (representative of ≥4 blots). (H) Quantification of 15-kDa band and 120 plus 250 kDa oligomer band density in gels represented in G (n ≥ 3 for all bands, *P = 0.0331 for 120 plus 250 kDa and 0.0417 for 15 kDa compared with control). (I) Schematic of regulation of PT (c-subunit) pore by ATP synthase F1. (Left) CypD and Ca2+ expand the c-subunit ring and open the pore by releasing F1. (Right) CsA, Bcl-xL, and ADP/ATP close the c-subunit pore by positioning beta-subunit over its mouth.

