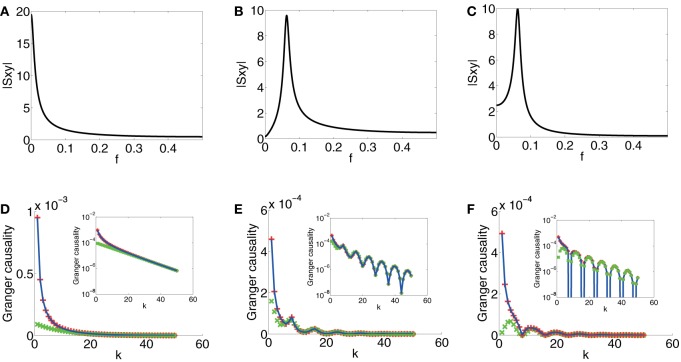
Figure 4.
Contrast between spectra and GC sampling structures for the first class. Magnitude of Sxy (|Sxy|) vs. frequency f (f = ) (black) for (A) Case 1.1. (B) Case 1.2. (C) Case 1.3. (D) Comparison of F(k)y → x obtained through numerical solution Equation (15) (blue), asymptotic expressions Equation (2) in Supplementary Material (red plus) and Equation (18) (green cross) vs. sampling interval k for Case 1.1. (E) Comparison of F(k)y → x obtained through numerical solution Equation (15) (blue), Equation (5) in Supplementary Material (red plus) and Equation (19) (green cross) vs. sampling interval k for Case 1.2. (F) Comparison of F(k)y → x obtained through numerical solution Equation (15) (blue), Equation (9) in Supplementary Material (red plus) and Equation (21) (green cross) vs. sampling interval k for Case 1.3. Insets are corresponding log-linear plots of GC vs. sampling interval length k. The exponential decay is clearly seen in the insets. The parameters are C = 104, τd = 0.05, and β = .

