
Figure 7.
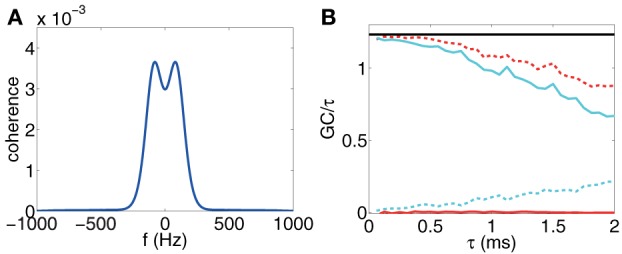
(A) Coherence vs. frequency f. (b) F(τ)x → y (red), F(τ)y → x (cyan), F(τ)x,y (red dash), F(τ)x · y (cyan dash) for voltage time series and Fx,y computed through Equation (25) (black horizontal line) vs. sampling interval length τ. The time series are generated by the I&F network whose topology is shown in Figure 1A with parameters ν = 1 ms−1, s = 0.02, λ = 0.0177. Note that we have subtracted the estimation bias of GC from the estimate of GC values for (B). The procedure of removing biases is described in Appendix C in Supplementary Material.