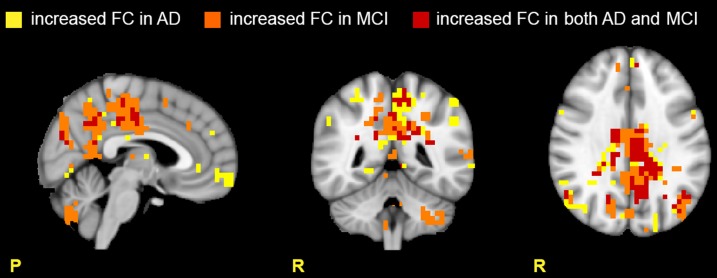
Figure 3.
Areas with increased FC in the RSNs. Images show areas with increased FC (p ≤ 0.05, TFCE-corrected) in AD compared to HC (yellow), in MCI compared to HC (orange), and in both AD and MCI compared to HC (red). Note that the cerebellum presents large areas of increased FC in MCI, suggesting active compensatory mechanisms.

