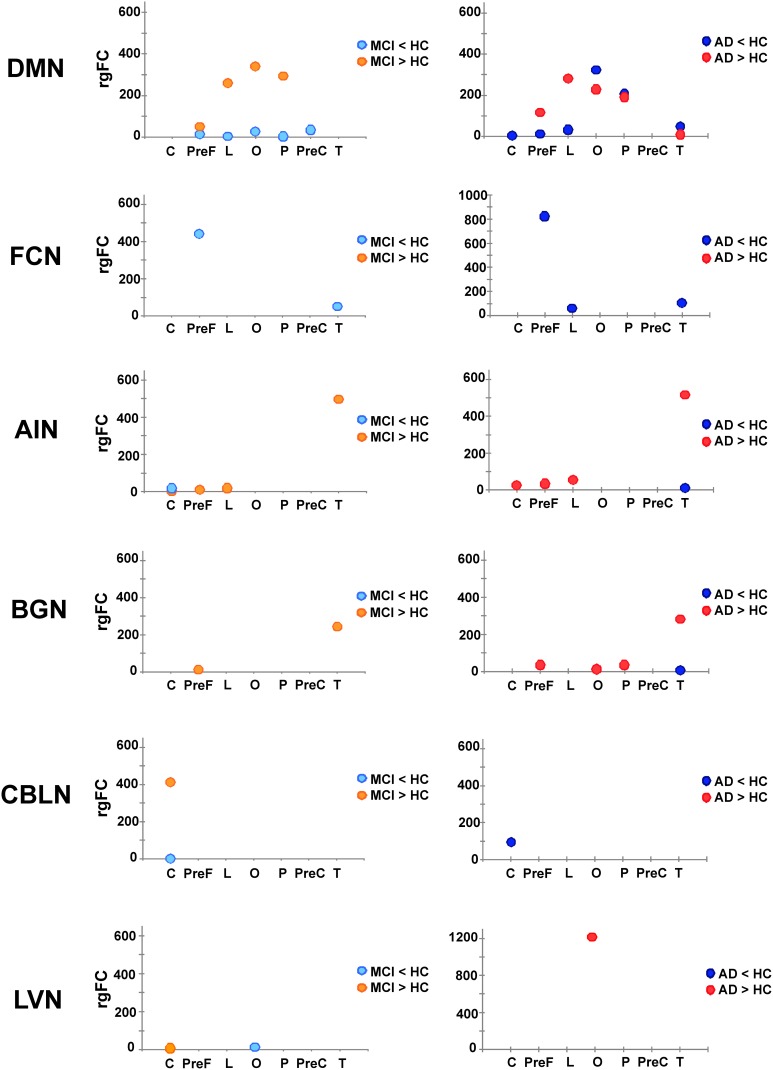
Figure 5.
Patterns of rgFC changes within specific RSNs. Pictures show the value of rgFC across conditions (MCI < HC and MCI > HC on the left side, AD < HC and AD > HC on the right one) for each sub-area of the brain: cerebellum (C), prefrontal (PreF), limbic (L), occipital (O), parietal (P) precentral (PreC) and temporal (T) for the networks that showed specific prototypical patterns: DMN, FCN, AIN, BGN, CBLN, and LVN.

